This is a continuation of my matmul series. I previously did a from-scratch iterative implementation on the CPU, and now I wanted to transfer my learnings to the GPU.
This blog is mainly just a worklog of me figuring out how GPUs work, through tools like ncu and reading the PTX.
Same ladder as Simon Boehm's blog, but performed on a consumer card and pushing past cuBLAS at the end.
 expandcredit: https://x.com/tenderizzation/status/2113415425338097908/photo/1
We'll be optimizing a hyper-specific kernel, but this will be fun for us because:
- big number = good
- we can learn a lot about good GPU optimizations!
- a lot of GPU inference / etc. seems to all be writing custom hyper-specific kernels, so this skill is applicable
Results
FP32 SGEMM, M = N = K = 4096, RTX 3060 (sm_86, 28 SMs), measured with nvbench (benches.cu, tests.cu). Clocks are locked at 2002MHz, and correctness is checked against cuBLAS (rtol 1e-2, atol 1e-3).
| Rung | Runtime | FLOP/s | % of cuBLAS |
|---|---|---|---|
| cuBLAS (FP32) | 15.81 ms | 8.69 T | 100% |
| 01 Naive | 1277 ms | 0.108 T | 1.2% |
| 02 GMEM Coalesced | 206.35 ms | 0.666 T | 7.7% |
| 03 SMEM | 129.89 ms | 1.06 T | 12.2% |
| 04 1D Blocktiling | 45.89 ms | 3.00 T | 34.5% |
| 05 2D Blocktiling | 21.69 ms | 6.34 T | 72.9% |
| 06 2D Transposed | 20.88 ms | 6.58 T | 75.8% |
| 07 Vectorized GMEM | 16.96 ms | 8.10 T | 93.2% |
| 08 Warptiling | 15.84 ms | 8.68 T | 99.9% |
| 09 Staged | 14.23 ms | 9.66 T | 110.8% |
GPU Model
In order to write good code, it's important to understand the hardware.
Firstly, GPUs use SIMT (single instruction, multiple thread) as opposed to the CPU's SIMD (single instruction, multiple data). GPU kernels are written from the perspective of a thread.
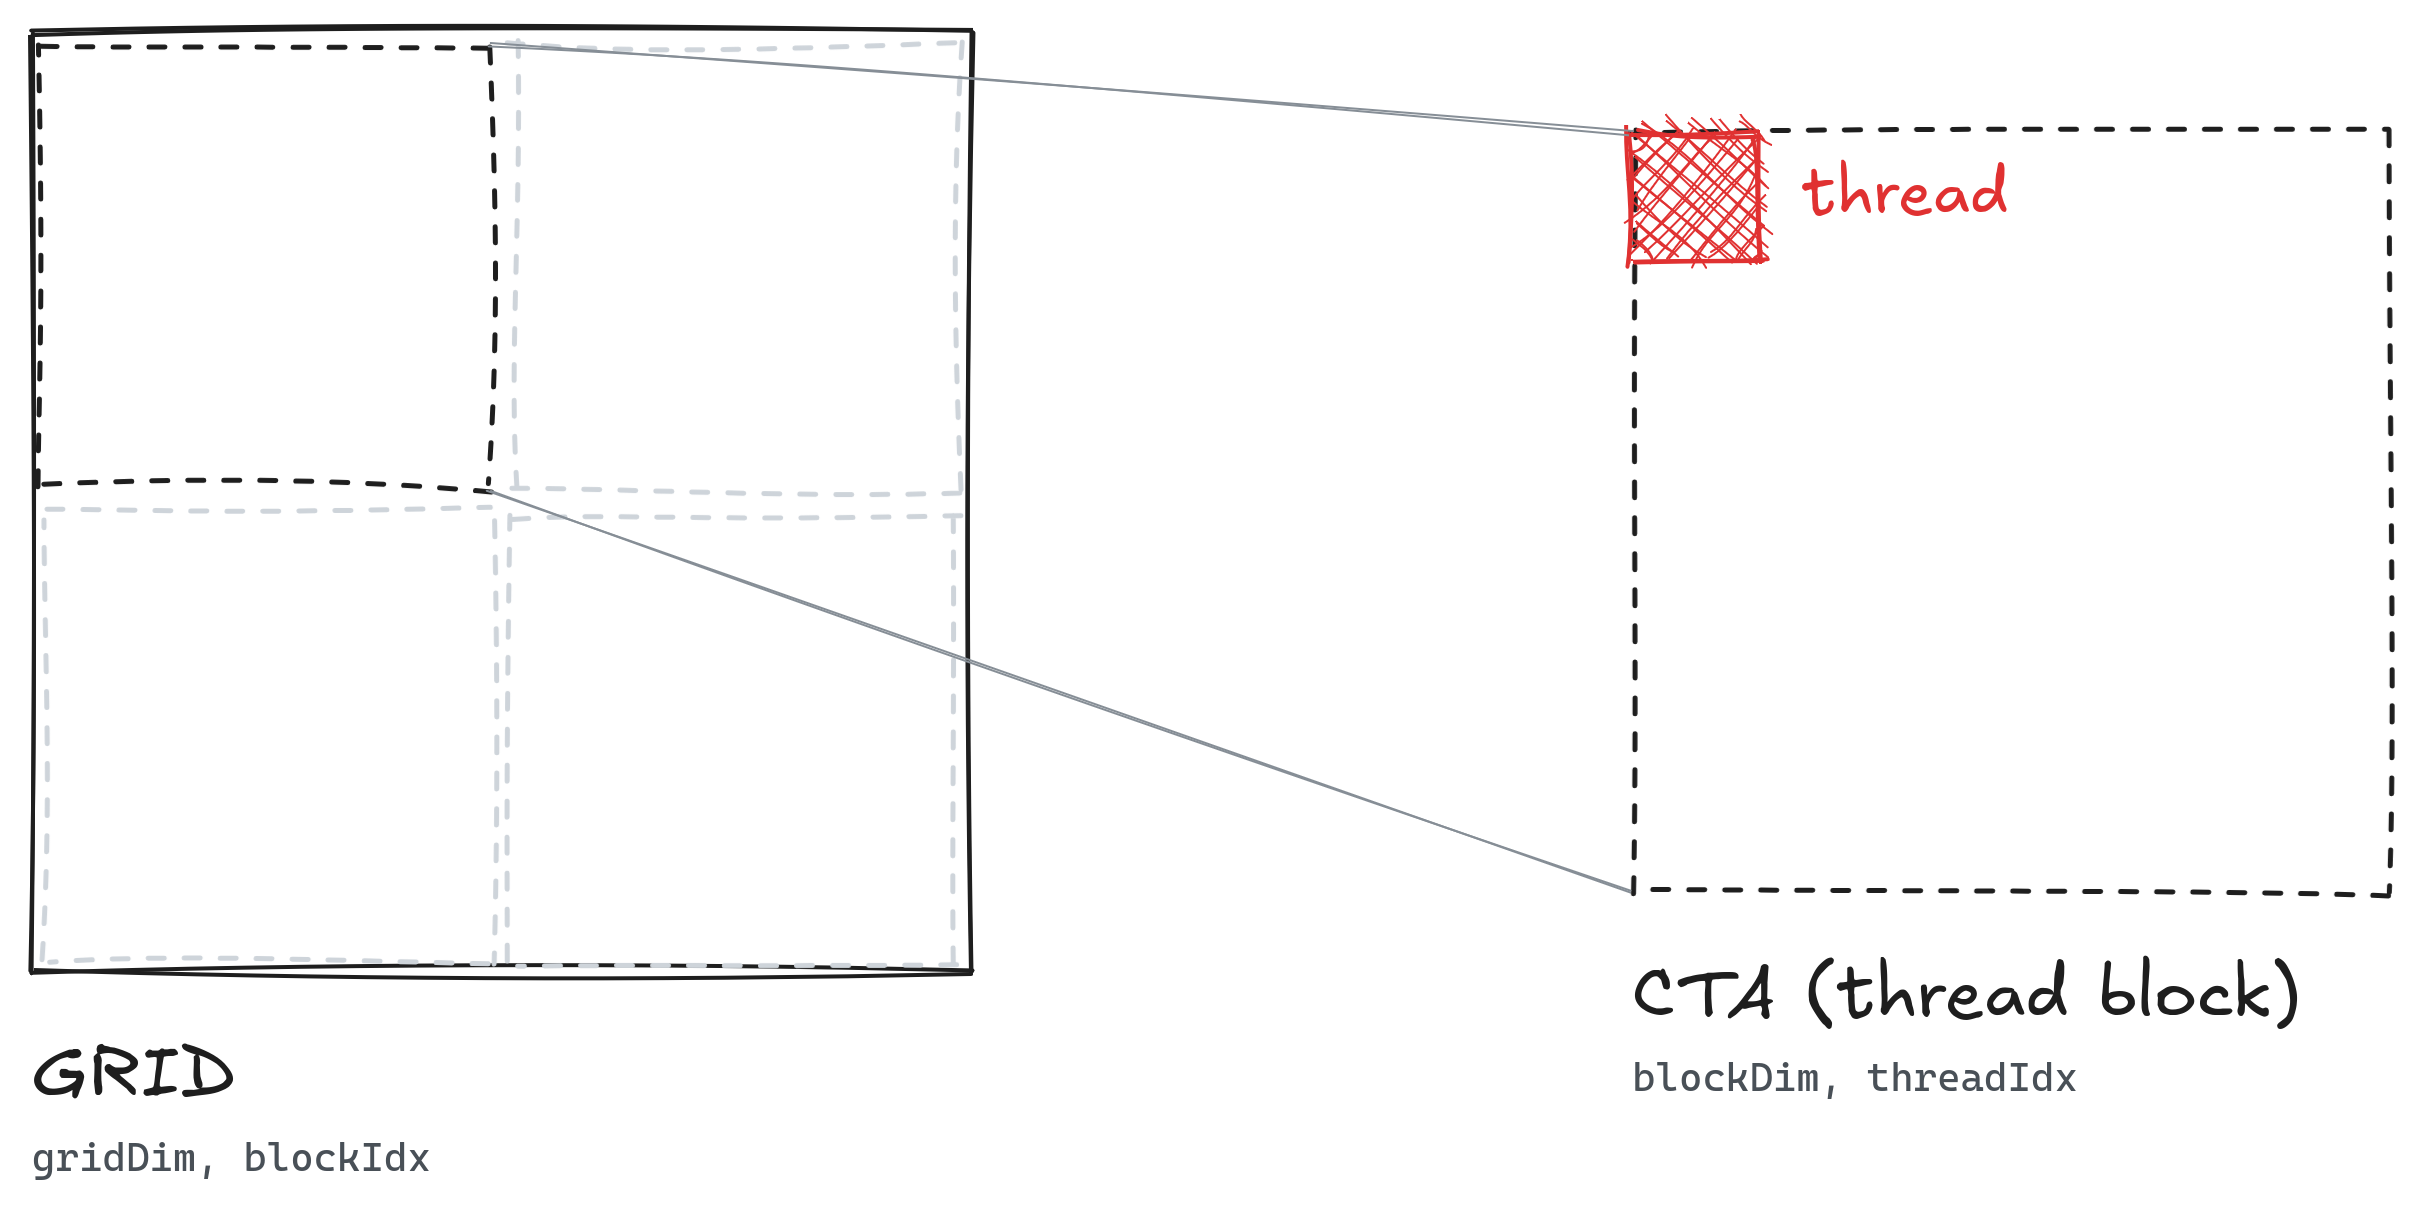 expandgrid → CTA (thread block) → thread, and the indices for each.
The GPU programming model defines grids, which are (up-to) 3D structures. Each element in a grid is a block, a simple (up to) 3D structure. Each element in a block is a thread.
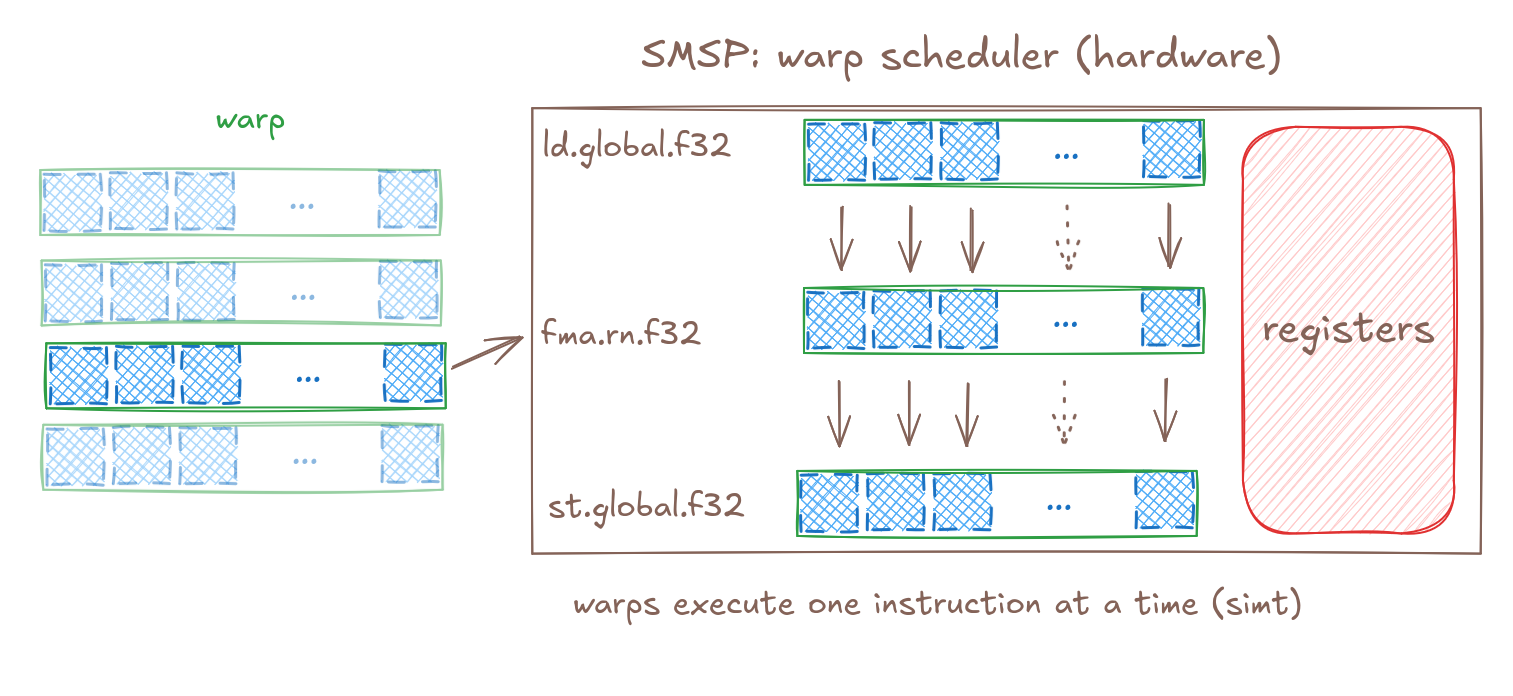
Hardware-wise, threads are grouped into sets of 32 called warps. The warp scheduler executes one instruction at a time (hence, SIMT)Older architectures and guides say "in lockstep". This is not tree for architectures past Volta, where each thread can have an independent program counter. However, its usually helpful to try and have them execute in lockstep (avoiding conditionals, etc) since warp divergence can be nasty. . The Streaming Multiprocessor Sub-Partition (SMSP) can choose to run different warps based on which one is stalled/ready (similar to how OS schedulers can schedule software threads). An important term to know is occupancy, meaning # of warps resident / max warps. Having more warps resident means more opportunities to latency-hide by switching to another ready warp.
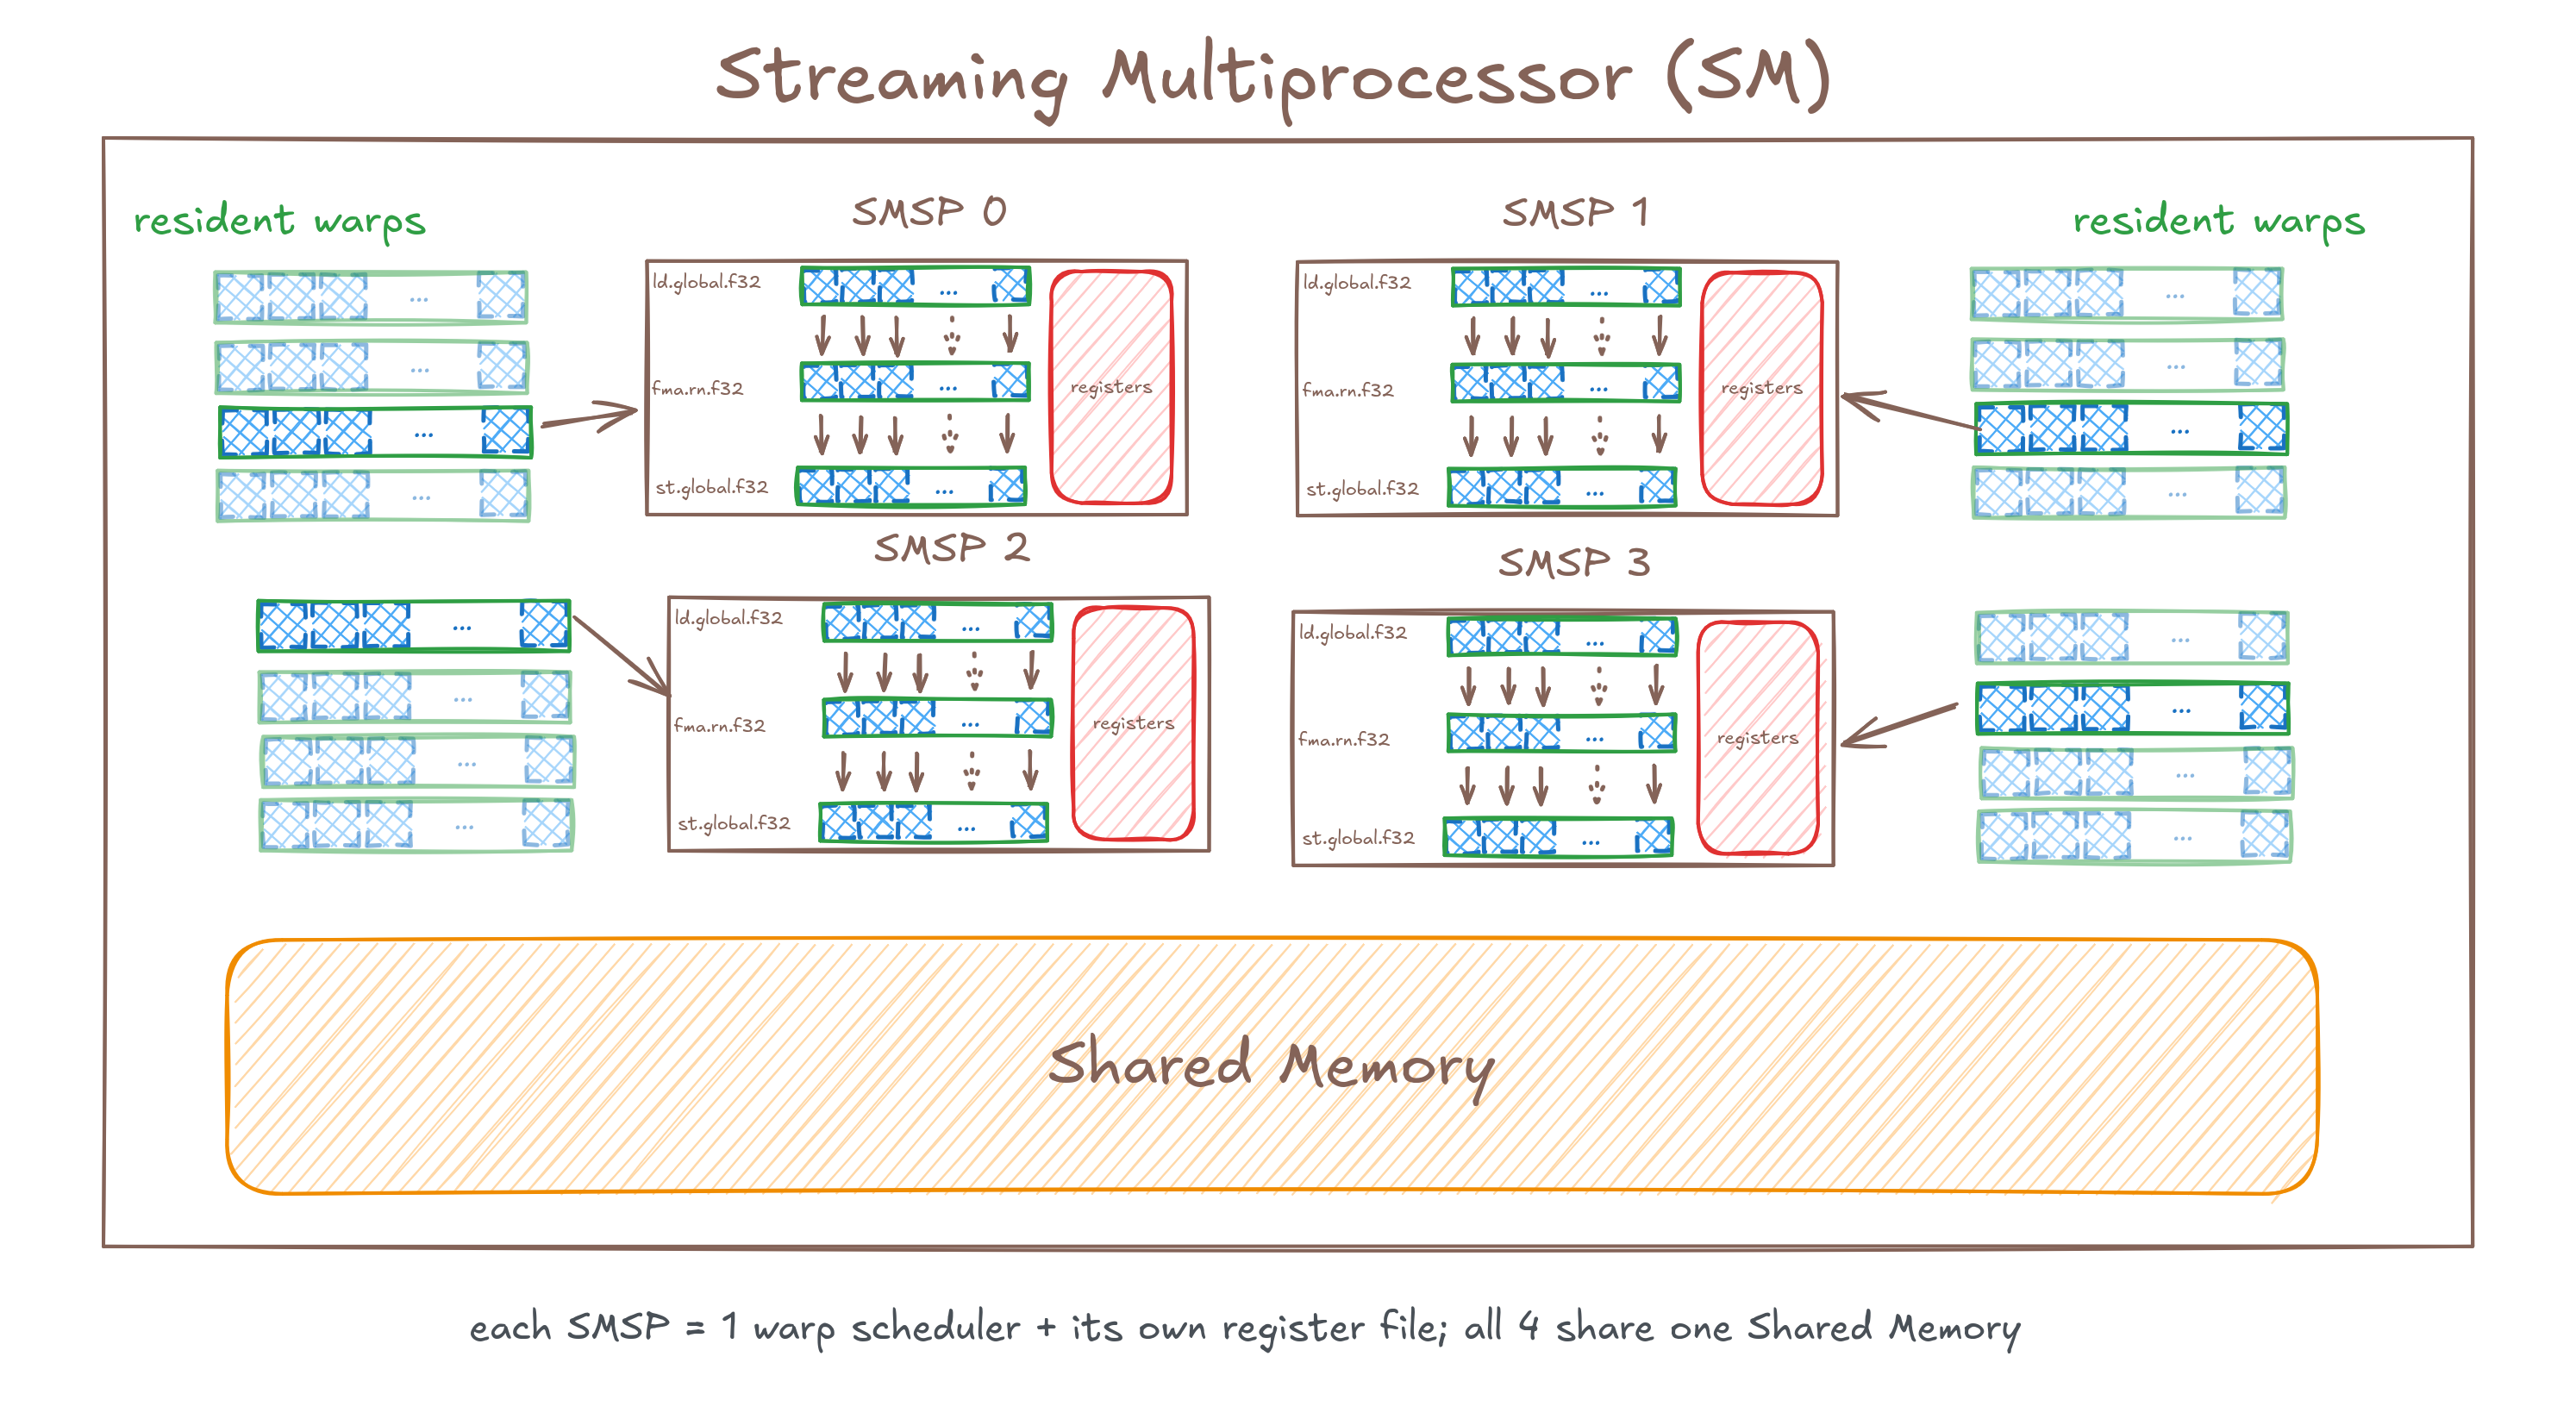
There are 4 of these SMSPs per SM. Each block is put onto an SM. All warps of the block become resident, and are ready to be executed on the warp schedulers.
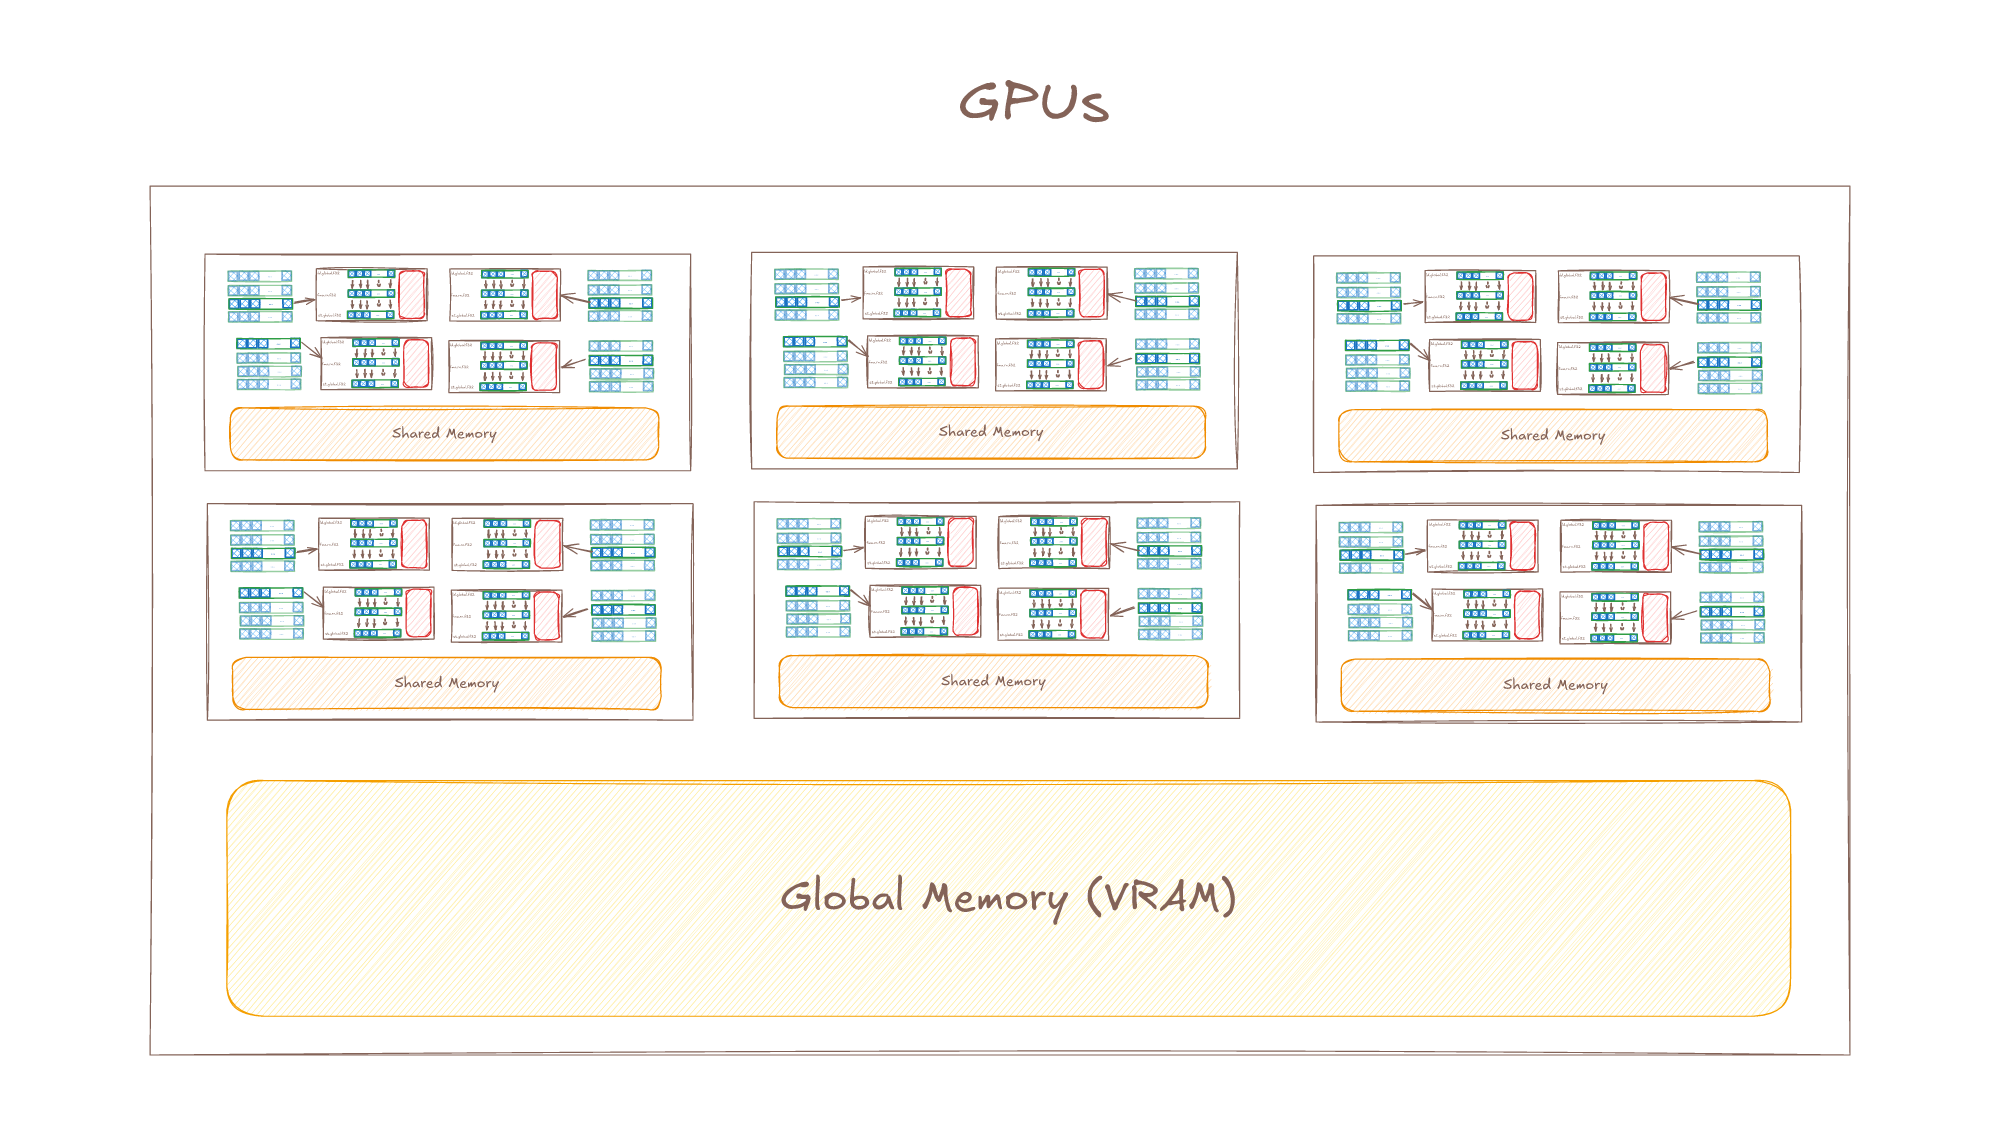
And finally, the GPU is many SMs stitched together with a pool of global memory (VRAM) to form the GPU.
On my 3060, there are 28 SMs, with 4 SMSPs each. There's 12GB of VRAM and 100KB of SMEM per SM.
ncu
We'll trickle this information as we go along, but we'll use ncu a lot throughout this post. Some key things to be aware of:
- metrics: a number, backed by some sort of counter(s)
- sections: a grouping of these metrics
Some common sections we'll use:
- SpeedOfLight: Shows performance relative to roofline (maximum possible). Useful for showing memory vs compute bound
- ComputeWorkloadAnalysis: Shows how the compute resources are being used
- MemoryWorkloadAnalysis: Shows how memory resources are being used
- WarpStateStats: Very useful. Shows the average number of cycles a warp spends in a given state per issued instruction. Helps identify where the stalls are and why they aren't issuing. You'll see the following common stalls:
- Selected: issued. Always 1.
- Long scoreboard: Waiting on global memory, because another operation needs that result
- Short scoreboard: Same thing, but for shared memory
- Barrier: a
__syncthreads() - Not Selected: Ready but another warp was issued instead
More can be found in: https://docs.nvidia.com/nsight-compute/ProfilingGuide/index.html#introduction
Naive
Each thread is given a set of variables to identify itself, which will help with distributing work: blockDim, blockIdx, threadIdx
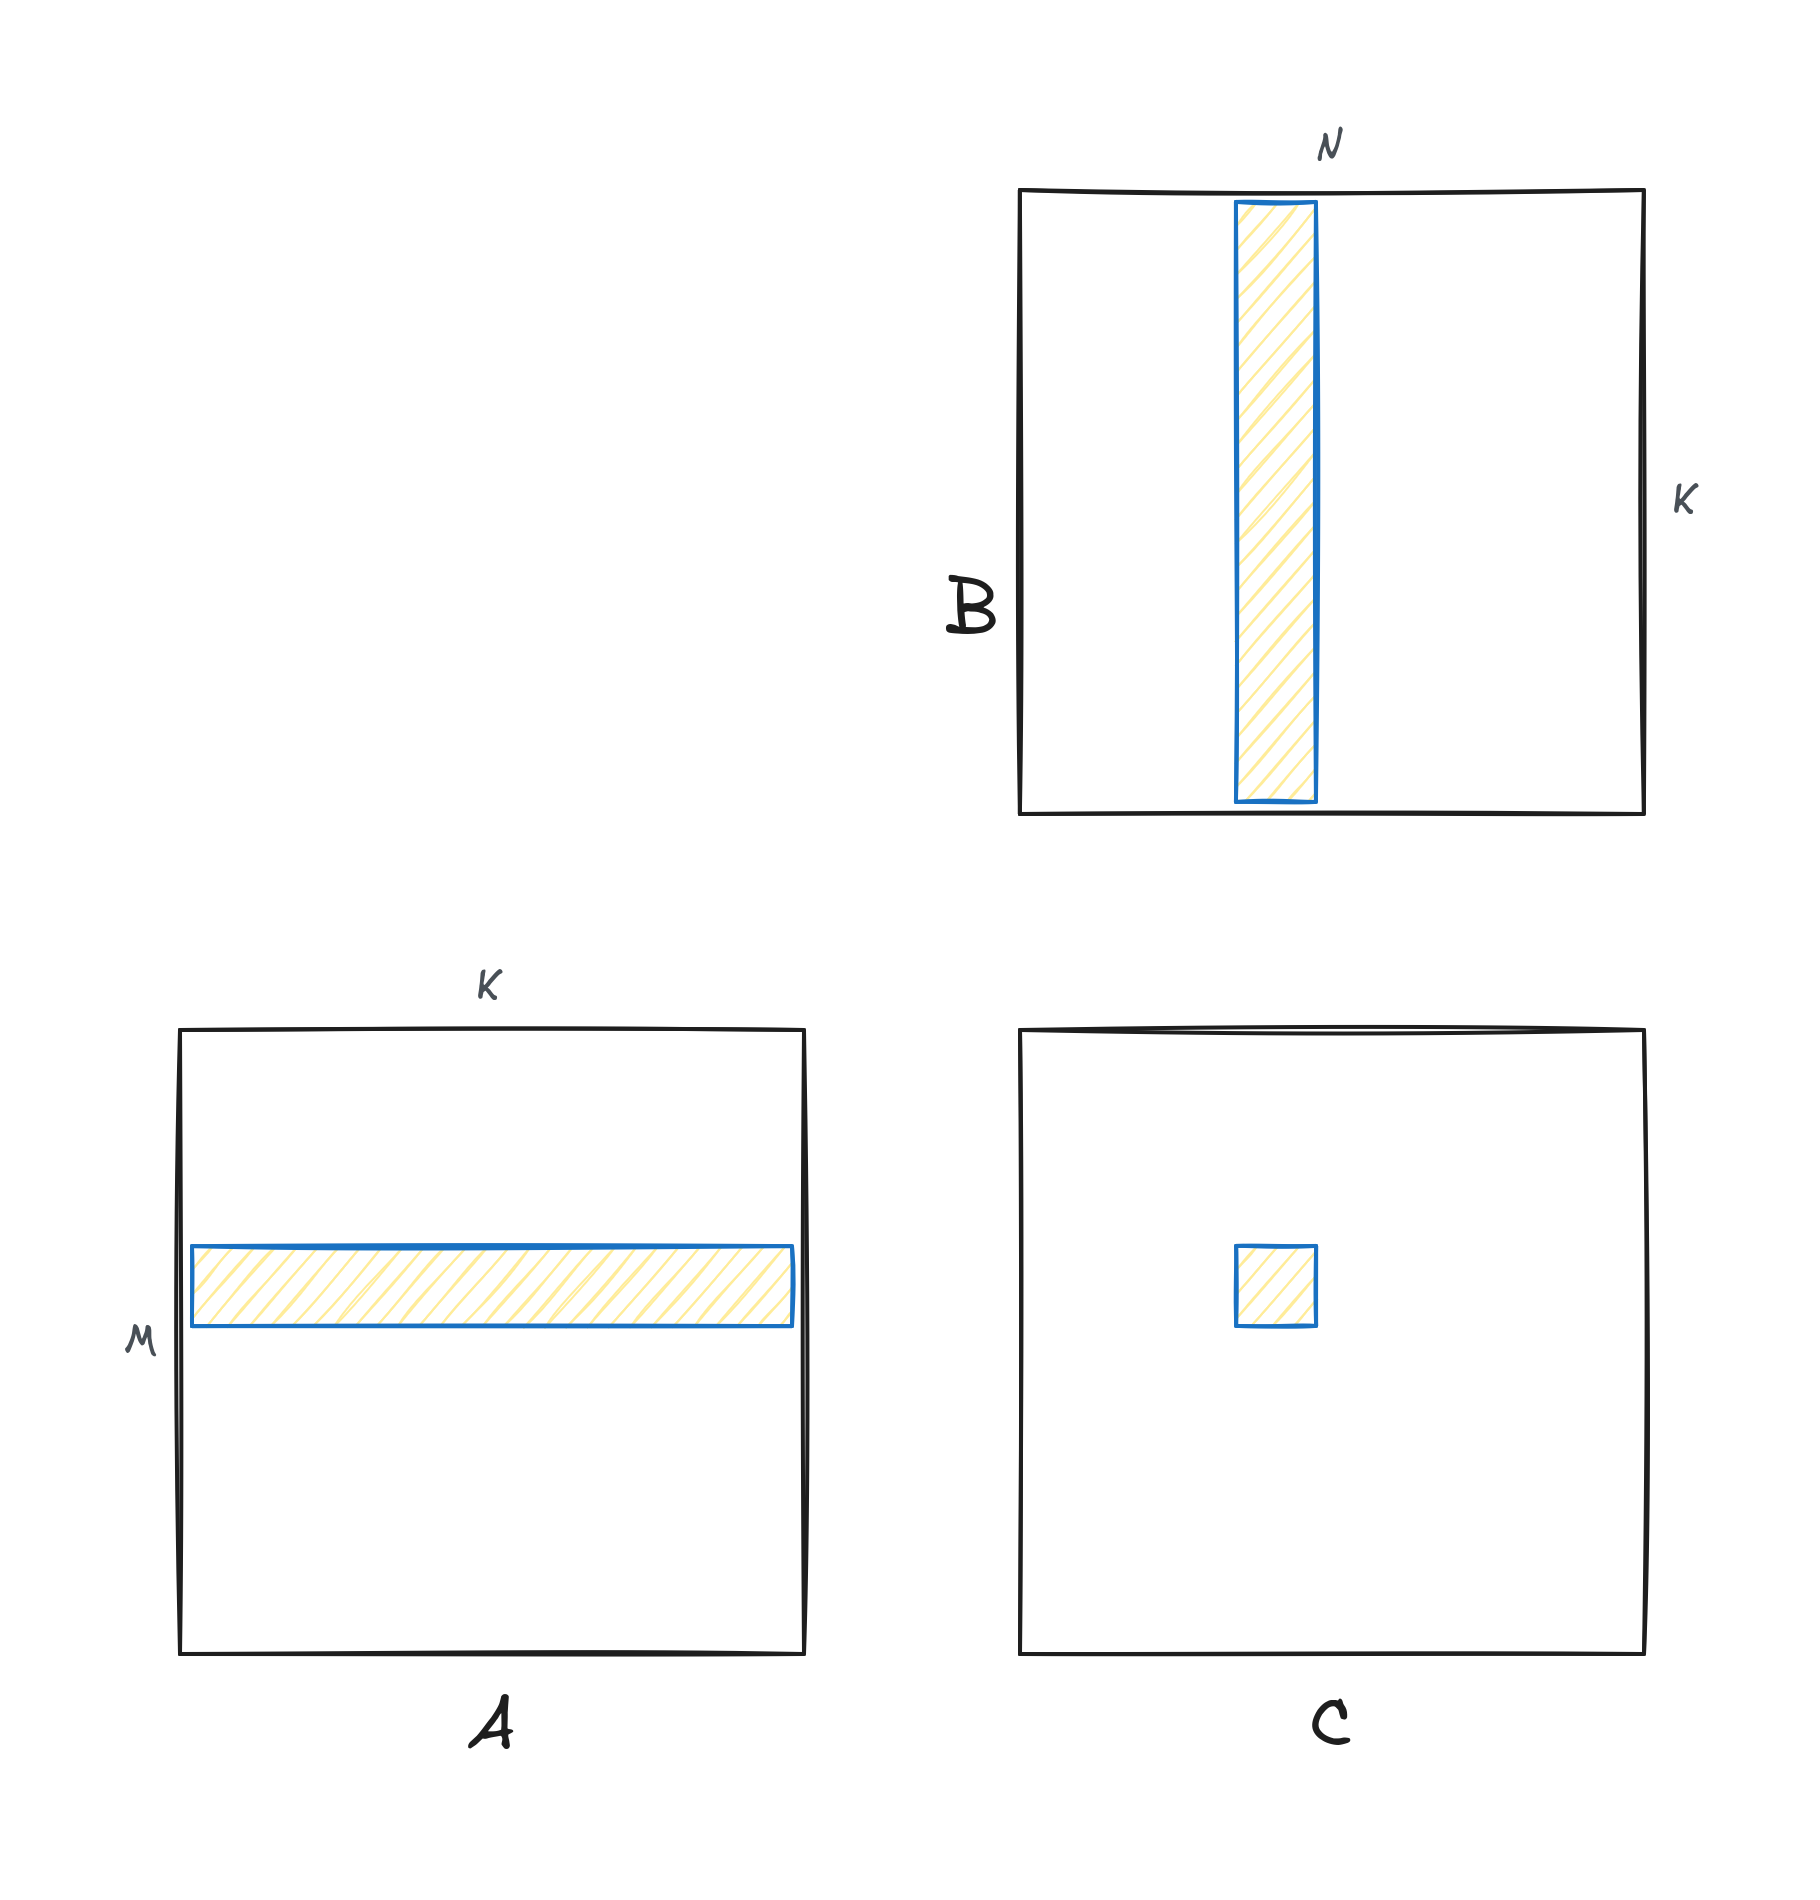 expandone thread, one element of C: a row of A, a column of B, no reuse.
For the first approach, we'll go the simplest way. Give each thread an independent (row, col) pair, and have it compute the dot product.01_naive.cu
Profiling with ncu, we immediately see the glaring issues:
ncu --kernel-name naiveKernel --launch-count 1 --section MemoryWorkloadAnalysis_Tables

Section: Memory Workload Analysis Tables
------------------------------------------ ----------- --------------
Metric Name                                Metric Unit   Metric Value
------------------------------------------ ----------- --------------
DRAM Throughput                                      %           1.64
L1TEX Hit Rate For Global Loads                      %          99.14
L1TEX Hit Rate For Global Stores                     %          80.57
L1TEX Hit Rate For Local Loads                       %              0
L1TEX Hit Rate For Local Stores                      %              0
L1TEX Sectors                                   sector 70,883,441,165
L1TEX Throughput Local Loads                  sector/s              0
L1TEX Throughput Local Stores                 sector/s              0
L1TEX Throughput                                     %          99.07
L2 Hit Rate For Loads                                %          52.15
L2 Hit Rate For Stores                               %         100.34
L2 Throughput Loads                          sector/us         446.41
L2 Throughput Stores                         sector/us          16.25
L2 Throughput                                        %           1.49
Maximum Bytes Per Sector For Global Loads  byte/sector             32
Average Bytes Per Sector For Global Loads  byte/sector              4
Maximum Bytes Per Sector For Global Stores byte/sector             32
Average Bytes Per Sector For Global Stores byte/sector              4
Maximum Bytes Per Sector For Local Loads   byte/sector             32
Average Bytes Per Sector For Local Loads   byte/sector              0
Maximum Bytes Per Sector For Local Stores  byte/sector             32
Average Bytes Per Sector For Local Stores  byte/sector              0
------------------------------------------ ----------- --------------
A note on reading ncu traces: The percentages usually mean % of roofline (i.e. max the unit can do).
We can see that our naive kernel is hammering our L1/TEX cache, hitting 99% of its max throughput. This is already showing how memory-bound our naive kernel is.
The main issue is that consecutive blocks of 32 threads (a warp) are requesting different rows. When warps access the same or consecutive memory regions, the hardware can either broadcast it or coalesce it to reduce the overall amount of memory traffic.
GMEM Coalesced
Our next optimization is coalescing. Instead, each block of 32 threads gets handed the same row but different columns. This favors us in two ways:
- we can now broadcast the row
- Since consecutive columns are also consecutive in memory, we can coalesce the loads as well02_gmem.cu
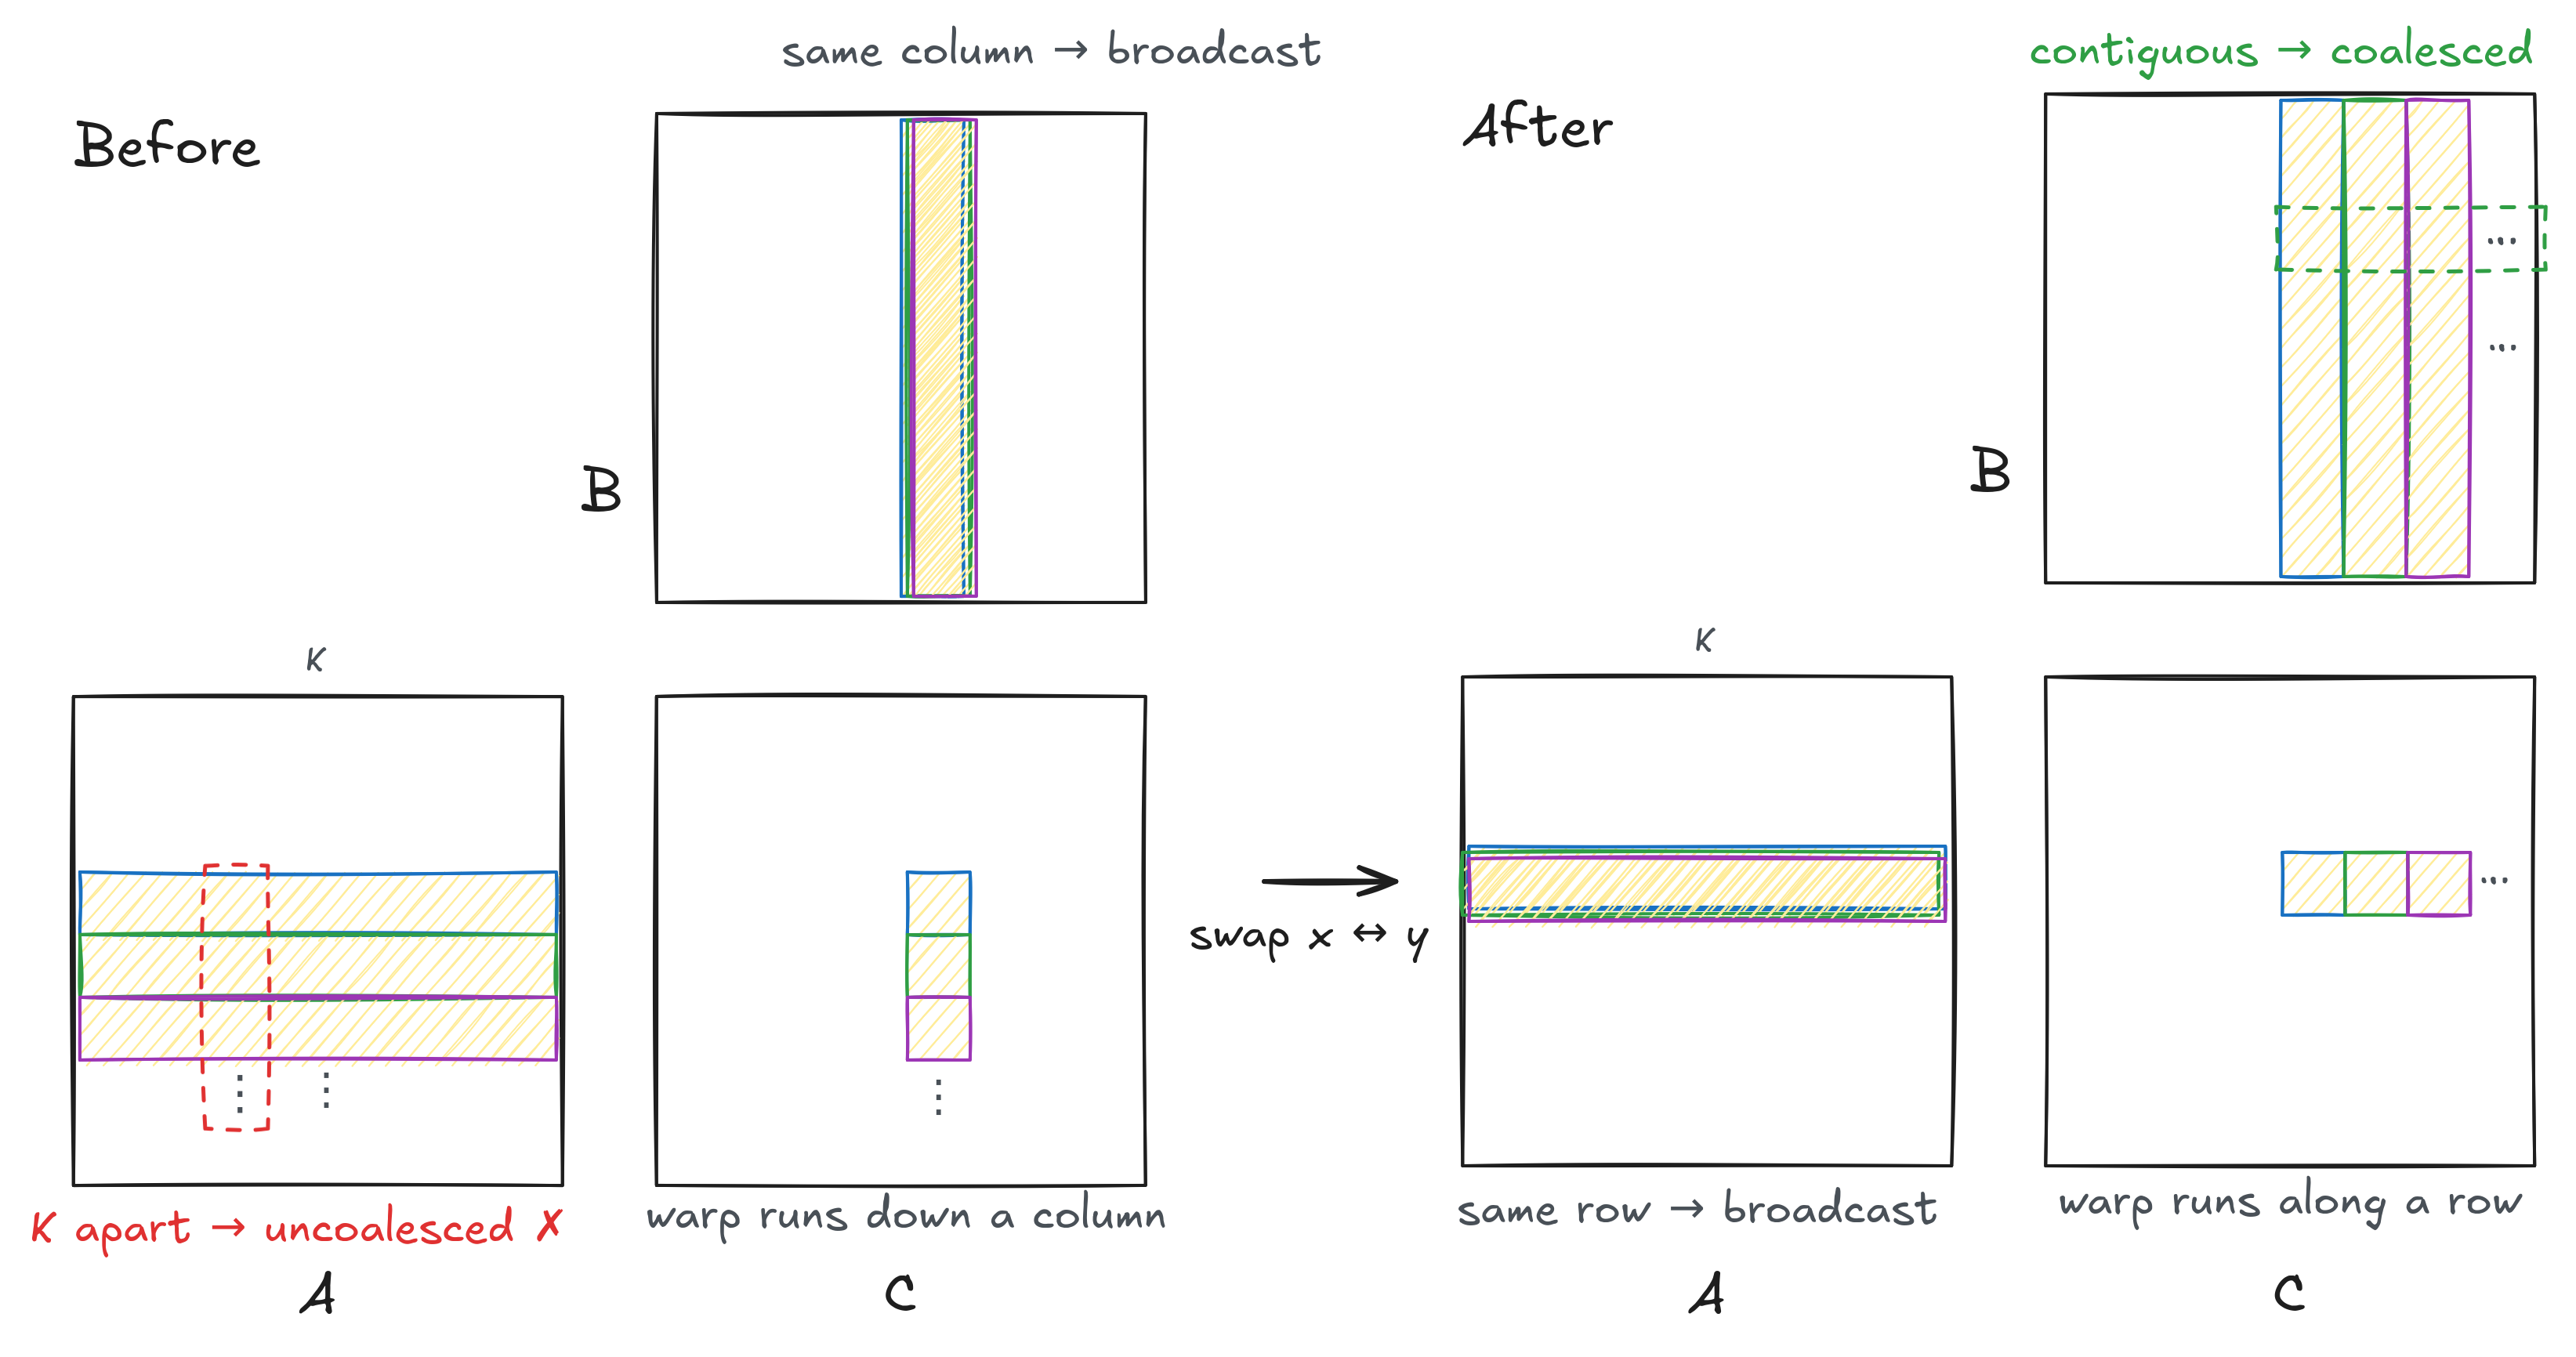 expandbefore, a warp walks down a column; after the swap, along a row.
Profiling:
ncu --kernel-name GMEMCoalescedKernel --launch-count 1 --section SpeedOfLight

----------------------- ----------- --------------
Metric Name             Metric Unit   Metric Value
----------------------- ----------- --------------
DRAM Frequency                  Ghz           8.79
SM Frequency                    Ghz           1.87
Elapsed Cycles                cycle    399,418,020
Memory Throughput                 %          76.87
DRAM Throughput                   %           9.87
Duration                         ms         213.88
L1/TEX Cache Throughput           %          76.94
Waves Per SM                                585.14
L2 Cache Throughput               %           7.90
SM Active Cycles              cycle 398,894,796.14
Compute (SM) Throughput           %          76.87
----------------------- ----------- --------------
L1TEX pressure dropped from 99% to 77%, so the change did something. Here ncu is somewhat lying: even though compute throughput is high, we are still definitely memory bound. Look at the breakdown of compute analysis:
ncu --kernel-name GMEMCoalescedKernel --launch-count 1 --section ComputeWorkloadAnalysis --print-details all

---------------- ----------- ------------
Metric Name      Metric Unit Metric Value
---------------- ----------- ------------
LSU                        %        76.89
Shared FMA Heavy           %        24.64
FMA Lite                   %         9.01
...
---------------- ----------- ------------
So most of the computation isn't even the FMAs (which is what matrix multiplication is), but rather the LSU (load/store unit), responsible for calculating all of the addresses and details in fetching.
So the main goal is to promote reuse. We're loading elements for 1 value, which is why we are so memory bound.
SMEM
But before that, let's do a brief introduction into Shared Memory. Something genuinely exciting about GPUs is that it allows us programmers to control caching behavior.
L1 cache and SMEM on the GPU are actually the same block of hardware. The difference is being programmer-managed vs hardware-managed.
Work is scheduled onto an SM by blocks, so we have to zoom out and think at the block-level when dealing with SMEM.
Every block takes is assigned 32 rows and 32 columns. Instead, we can have it load a small section of this row & column, load it to shared memory, accumulate it. This works because we have 1024 threads needing 32 sub-rows and 32 sub-cols, so the reuse is genuinely good.03_smem.cu
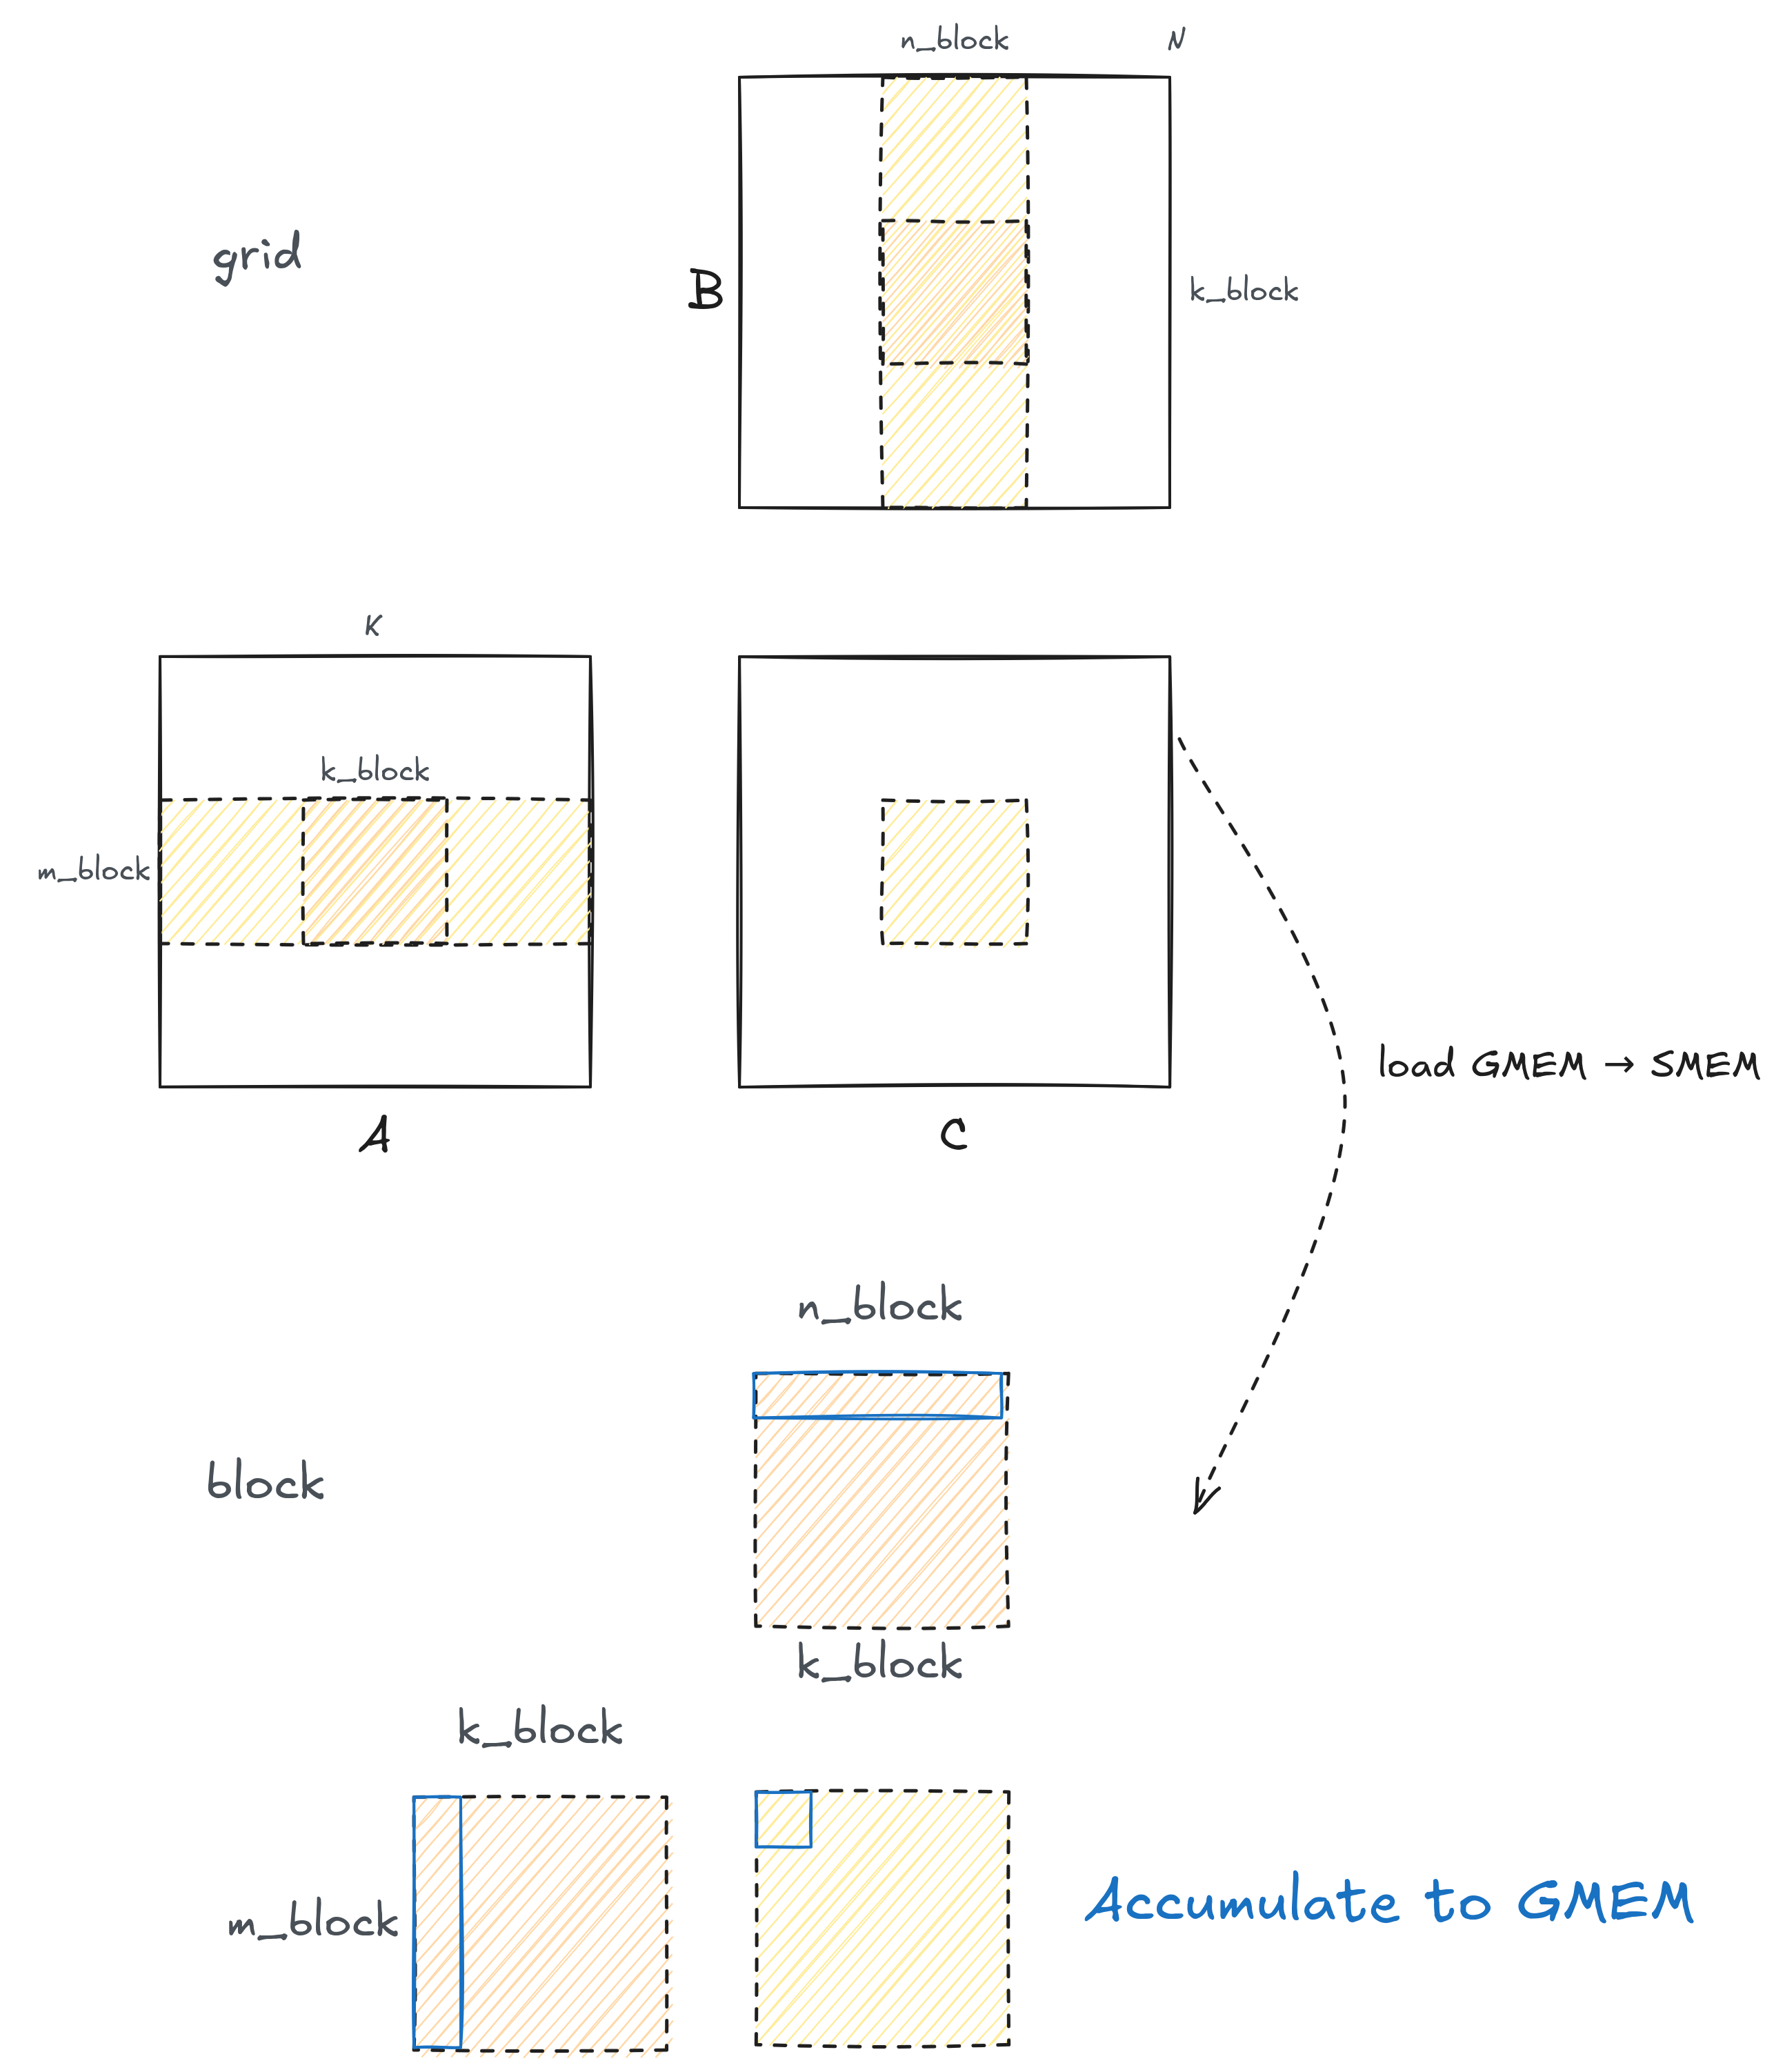 expanda block owns an m_block × n_block tile and stages each k-slice in SMEM.
This is very similar to tiling / blocking, except that shared memory stores are explicit!
We see another huge improvement here, but why? Aren't L1 and SMEM the same hardware? Turns out, the compiler was also able to make an improvement.
Look at the SASS:
/*0450*/  FFMA R30, R30, R9, R29 ;
/*0460*/  LDS R24, [R7.X4+0x1680] ;
/*0470*/  FFMA R33, R33, R10, R30 ;
/*0480*/  LDS R29, [R7.X4+0x1700] ;
/*0490*/  FFMA R26, R26, R11, R33 ;
/*04a0*/  LDS R30, [R7.X4+0x1780] ;
/*04b0*/  LDS R33, [R7.X4+0x1800] ;
/*04c0*/  LDS.128 R8, [R4+0x40] ;
/*04d0*/  FFMA R31, R31, R16, R26 ;
/*04e0*/  LDS R26, [R7.X4+0x1880] ;
/*04f0*/  FFMA R32, R32, R17, R31 ;
/*0500*/  LDS R31, [R7.X4+0x1900] ;
/*0510*/  FFMA R25, R25, R18, R32 ;
/*0520*/  LDS R32, [R7.X4+0x1980] ;
/*0530*/  FFMA R28, R28, R19, R25 ;
/*0540*/  LDS R25, [R7.X4+0x1a00] ;
/*0550*/  FFMA R27, R27, R12, R28 ;
/*0560*/  LDS.128 R16, [R4+0x50] ;
/*0570*/  FFMA R24, R24, R13, R27 ;
/*0580*/  LDS R28, [R7.X4+0x1a80] ;
/*0590*/  FFMA R29, R29, R14, R24 ;
/*05a0*/  LDS R27, [R7.X4+0x1b00] ;
/*05b0*/  FFMA R30, R30, R15, R29 ;
/*05c0*/  LDS R24, [R7.X4+0x1b80] ;
/*05d0*/  LDS R29, [R7.X4+0x1c00] ;
/*05e0*/  FFMA R33, R33, R8, R30 ;
/*05f0*/  LDS.128 R12, [R4+0x60] ;
/*0600*/  LDS R30, [R7.X4+0x1c80] ;
/*0610*/  FFMA R26, R26, R9, R33 ;
/*0620*/  LDS R33, [R7.X4+0x1d00] ;
/*0630*/  FFMA R31, R31, R10, R26 ;
/*0640*/  LDS R26, [R7.X4+0x1d80] ;
/*0650*/  FFMA R32, R32, R11, R31 ;
/*0660*/  LDS R31, [R7.X4+0x1e00] ;
/*0670*/  LDS.128 R8, [R4+0x70] ;
/*0680*/  FFMA R25, R25, R16, R32 ;
/*0690*/  LDS R16, [R7.X4+0x1e80] ;
/*06a0*/  FFMA R32, R28, R17, R25 ;
/*06b0*/  LDS R17, [R7.X4+0x1f00] ;
/*06c0*/  FFMA R27, R27, R18, R32 ;
/*06d0*/  LDS R28, [R7.X4+0x1f80] ;
/*06e0*/  FFMA R24, R24, R19, R27 ;
/*06f0*/  FFMA R29, R29, R12, R24 ;
/*0700*/  FFMA R30, R30, R13, R29 ;
/*0710*/  FFMA R33, R33, R14, R30 ;
/*0720*/  FFMA R26, R26, R15, R33 ;
/*0730*/  FFMA R31, R31, R8, R26 ;
/*0740*/  FFMA R16, R16, R9, R31 ;
/*0750*/  FFMA R17, R17, R10, R16 ;
/*0760*/  FFMA R17, R28, R11, R17 ;
/*0770*/  BAR.SYNC.DEFER_BLOCKING 0x0 ;
/*0780*/  @!P0 BRA 0x250 ;
/*0790*/  STG.E [R20.64], R17 ;
/*07a0*/  EXIT ;
ptxas vectorized the B loads into LDS.128, probably because the SMEM addresses are provably aligned. Pretty cool!The ptx shows ld.global.f32 %f15, [%rd13]; ld.global.f32 %f16, [%rd11]; fma.rn.f32 %f17, %f16, %f15, %f14;. Important to not forget that PTX gets optimized by ptxas, and to look at the SASS as well!
Now we can start looking at the individual warps in more detail:
ncu --kernel-name SMEMCoalescedKernel --launch-count 1 --section WarpStateStats

Table Name : Warp State (All Cycles)
------------------------ ----------- ------------
Metric Name              Metric Unit Metric Value
------------------------ ----------- ------------
Stall MIO Throttle              inst        24.07
Stall Long Scoreboard           inst         6.50
A memory request goes through a queue called the MIO. From the docs:
Warp was stalled waiting for the MIO (memory input/output) instruction queue to be not full. This stall reason is high in cases of extreme utilization of the MIO pipelines, which include special math instructions, dynamic branches, as well as shared memory instructions. When caused by shared memory accesses, trying to use fewer but wider loads can reduce pipeline pressure. Highly scattered memory accesses can also fill this queue when each access expands into many internal operations; improve access locality when this is the cause.
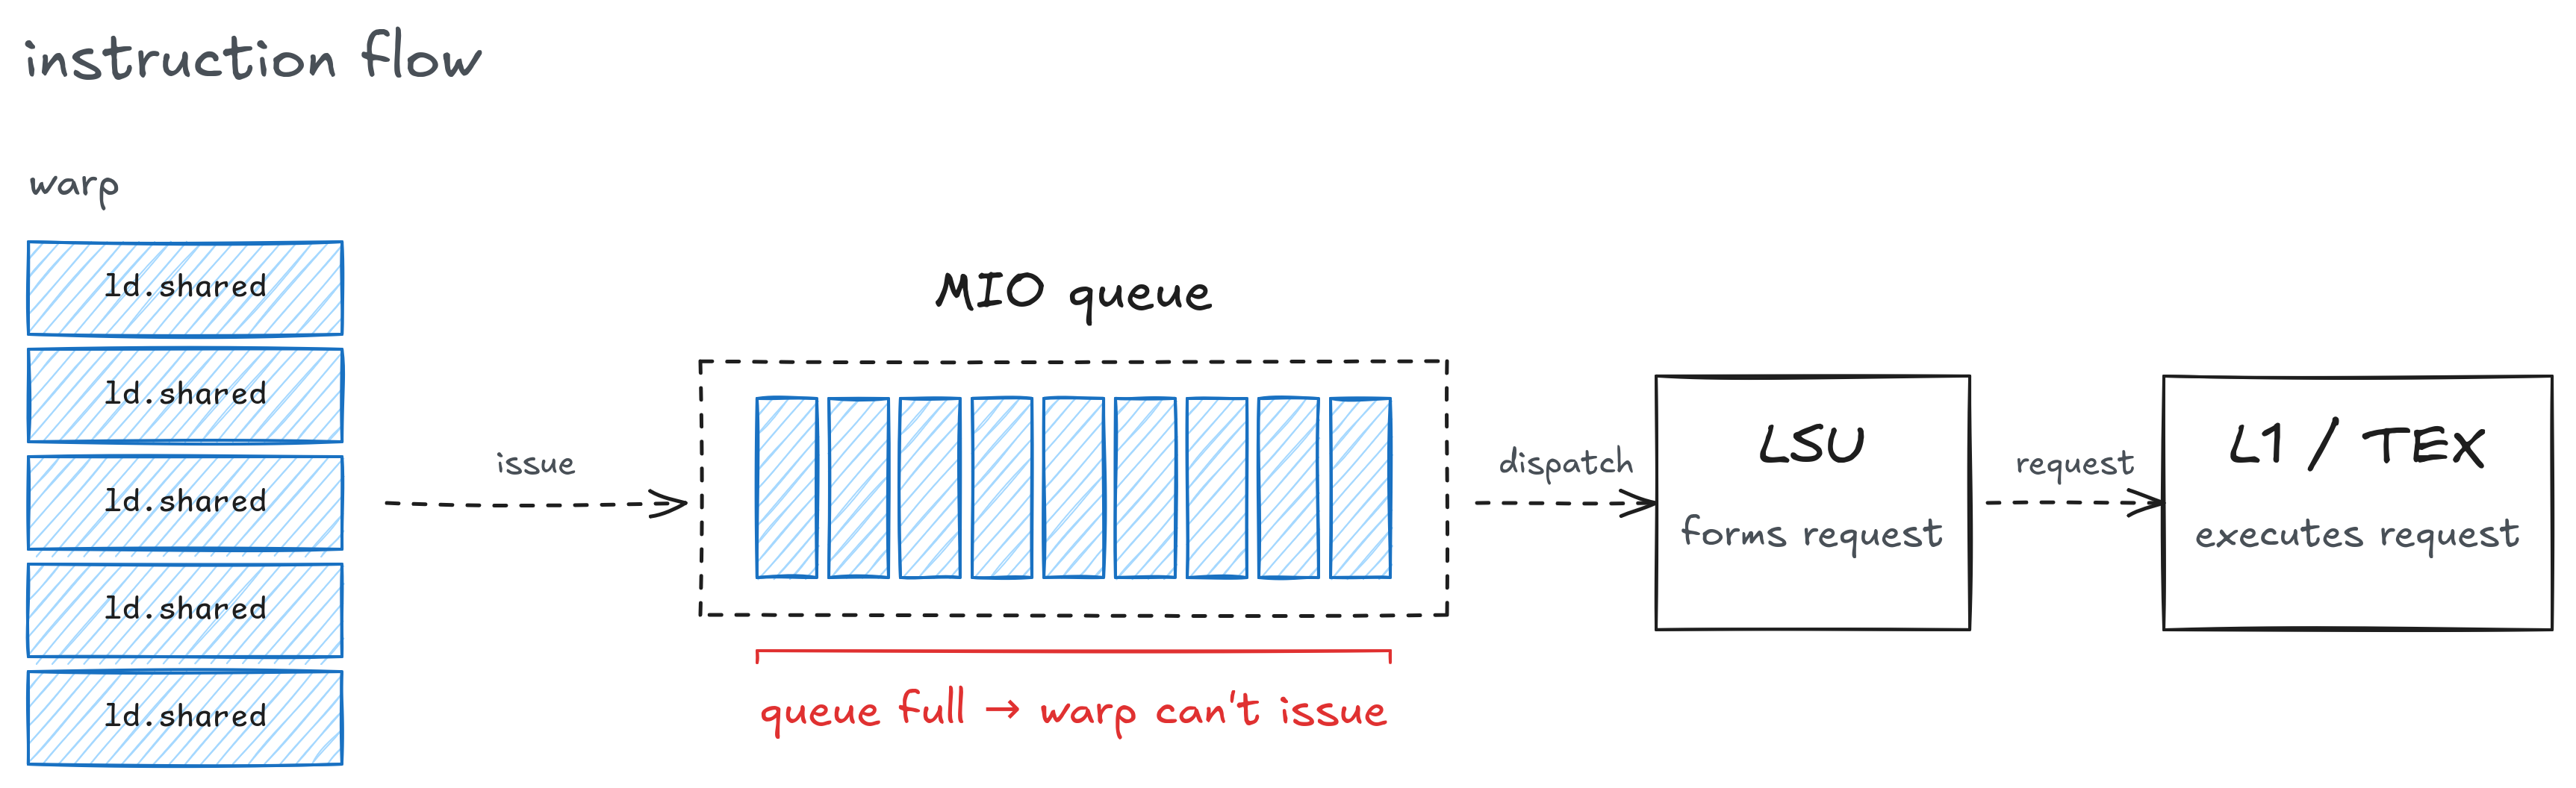 expandld.shared issues into the MIO queue; when it's full the warp can't issue.
A stall MIO throttle means we are forming too many instructions per FMA, which is backing up the queue.
1D Blocktiling
The key idea is to have each thread load more values, reuse them, and produce more values. This would help decrease the amount of reads from SMEM, solving our MIO throttle.
We'll have each thread calculate a strip of C. 04_1d.cu
We'll define 4 new variables: m_thread for how many elements each thread calculates, m_block, n_block, k_block for the size of the SMEM tile.
This way, we load elements and one element from B to produce elements, which is a much closer-to-one ratio.
In addition, we perform far fewer load instructions per FMA, which will help out our LSU. With the current parameters, we do 24 load instructions for 64 FMAs.
ncu --kernel-name BlockTiling1D --launch-count 1 --section WarpStateStats

Table Name : Warp State (All Cycles)
------------------------ ----------- ------------
Metric Name              Metric Unit Metric Value
------------------------ ----------- ------------
Stall MIO Throttle              inst         7.11
Stall Long Scoreboard           inst         6.72
Stall Barrier                   inst         5.48
Stall Not Selected              inst         1.56
Stall Wait                      inst         1.30
Selected                        inst         1.00
Stall Dispatch Stall            inst         0.43
Stall Short Scoreboard          inst         0.32
Stall LG Throttle               inst         0.07
Stall No Instruction            inst         0.06
Stall Branch Resolving          inst         0.03
Stall Math Pipe Throttle        inst         0.01
Stall Drain                     inst         0.00
Stall IMC Miss                  inst         0.00
Stall Membar                    inst            0
Stall Misc                      inst         0.00
Stall Sleeping                  inst            0
Stall Tex Throttle              inst         0.00
------------------------ ----------- ------------
And we can see even less MIO throttle!
Now that we have so many knobs, we're going to autotune and search for the best set of parameters for maximum performance.
2D Blocktiling
Let's extend the previous approach for even more reuse. Why limit ourselves to a strip? We create an m_thread x n_thread tile instead. It would also allow for massive reuse, because we perform (m + n) loads on m x n data, as opposed to (m + 1) loads on m data.05_2d.cu
Looking at the WarpStateStats:
ncu --kernel-name BlockTiling2D --launch-count 1 --section WarpStateStats

Table Name : Warp State (All Cycles)
------------------------ ----------- ------------
Metric Name              Metric Unit Metric Value
------------------------ ----------- ------------
Stall Not Selected              inst         1.85
Selected                        inst         1.00
Stall Dispatch Stall            inst         0.92
Stall Long Scoreboard           inst         0.92
Stall Barrier                   inst         0.89
Stall MIO Throttle              inst         0.82
Stall Short Scoreboard          inst         0.28
Stall Wait                      inst         0.25
Stall LG Throttle               inst         0.15
Stall Math Pipe Throttle        inst         0.07
Stall No Instruction            inst         0.01
Stall Branch Resolving          inst         0.00
Stall Drain                     inst         0.00
Stall IMC Miss                  inst         0.00
Stall Membar                    inst            0
Stall Misc                      inst         0.00
Stall Sleeping                  inst            0
Stall Tex Throttle              inst            0
------------------------ ----------- ------------
We've finally reduced MIO throttles! You'll notice that Long Scoreboard is down too - that means the warp was stuck waiting for a GMEM request to finish; more reuse means less time is spent roundtripping to GMEM
Looking at the SoL section:
ncu --kernel-name BlockTiling2D --launch-count 1 --section SpeedOfLight --print-details all

Table Name : Memory Throughput Breakdown
-------------------------------------------------------- ----------- ------------
Metric Name                                              Metric Unit Metric Value
-------------------------------------------------------- ----------- ------------
L1: Data Pipe Lsu Wavefronts                                       %        71.67
L1: Lsuin Requests                                                 %        39.10
L1: Lsu Writeback Active                                           %        39.03
DRAM: Cycles Active                                                %        24.46
L2: T Sectors                                                      %        20.28
...
-------------------------------------------------------- ----------- ------------
We see that Data Pipe Lsu Wavefronts is the highest. But what exactly is a wavefront? For this, we'll have to dig into how Shared Memory is partitioned.
Shared memory is split up into exactly 32 "banks", each capable of delivering one word/cycle. This is intentionally done to match the number of warps and allow for more memory bandwidth.
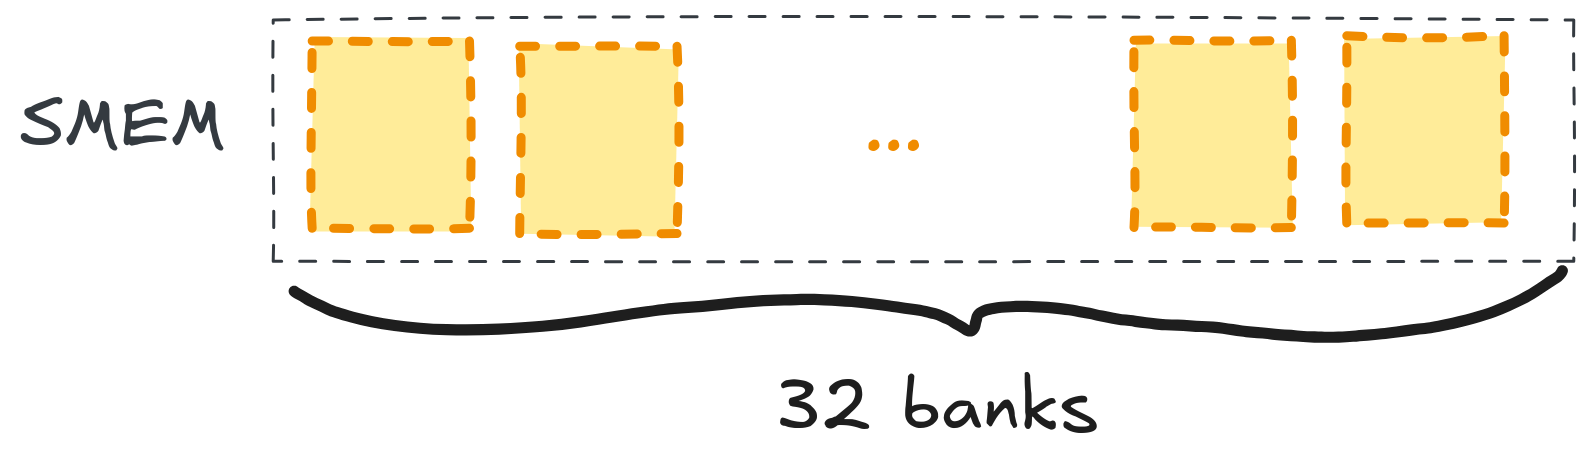 expandSMEM is 32 banks, one word each per cycle.
One wavefront is just one "pass" through the banks.
Each bank serves its own addresses. For example, bank 0 serves all addresses where the word index mod 32 is 0.
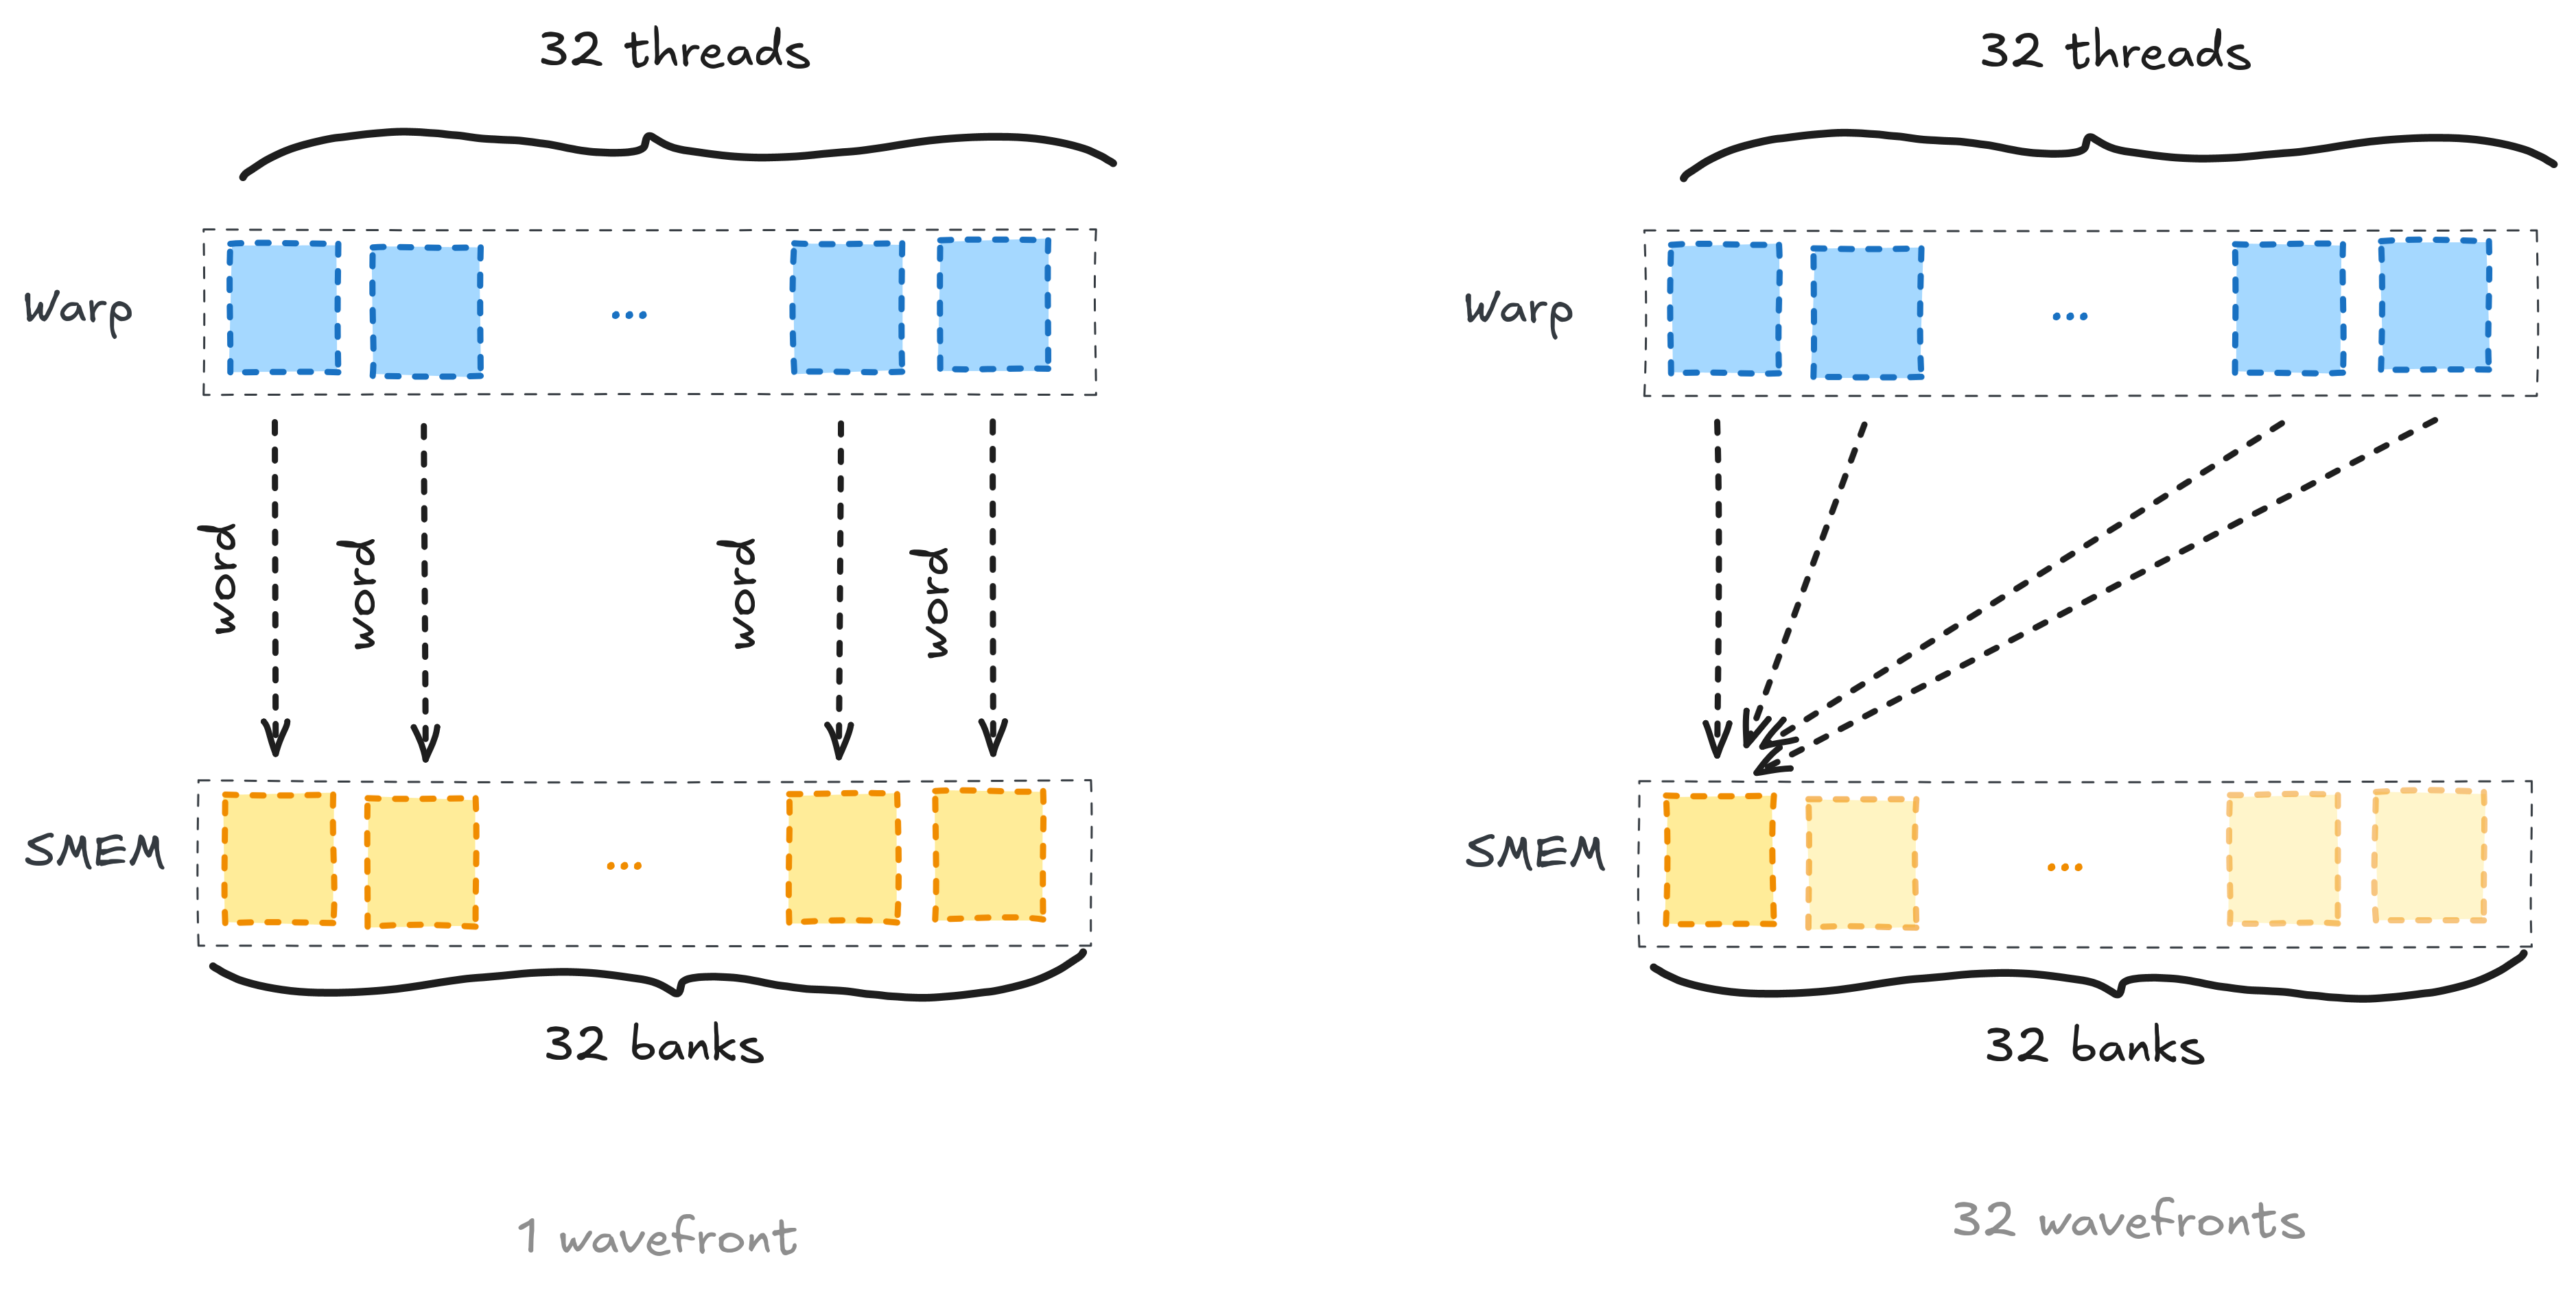 expandone word per bank is one wavefront; 32 threads on one bank is 32.
So if each thread requests a word from a different bank, we get maximum throughput. Note that this is requesting contiguous chunks of memory.
If all the threads request the same bank at different addresses, the wavefronts serialize, up to 32 passes. This happens if the access pattern within-warp is strided.
Now look at our inner pattern loop:
for (int idx_m = 0; idx_m < m_thread; idx_m++) {
	cacheM[idx_m] = As[(trow_c * m_thread + idx_m) * k_block + dot_idx];
}

for (int idx_n = 0; idx_n < n_thread; idx_n++) {
	cacheN[idx_n] = Bs[dot_idx * n_block + (tcol_c * n_thread) + idx_n];
}
Because of our autotuned parameters, trow_c is 0 for threads and 1 for threads in a warp. With m_thread = 8 and k_block = 8, those two values are 64 words apart, which is the same bank. So even though each instruction only asks for 2 distinct values, it still takes 2 passes.
cacheN is worse: tcol_c runs 0-15 and the stride is n_thread = 8, so columns land on the same bank (and do too). That's 4 wavefronts for 16 distinct values.
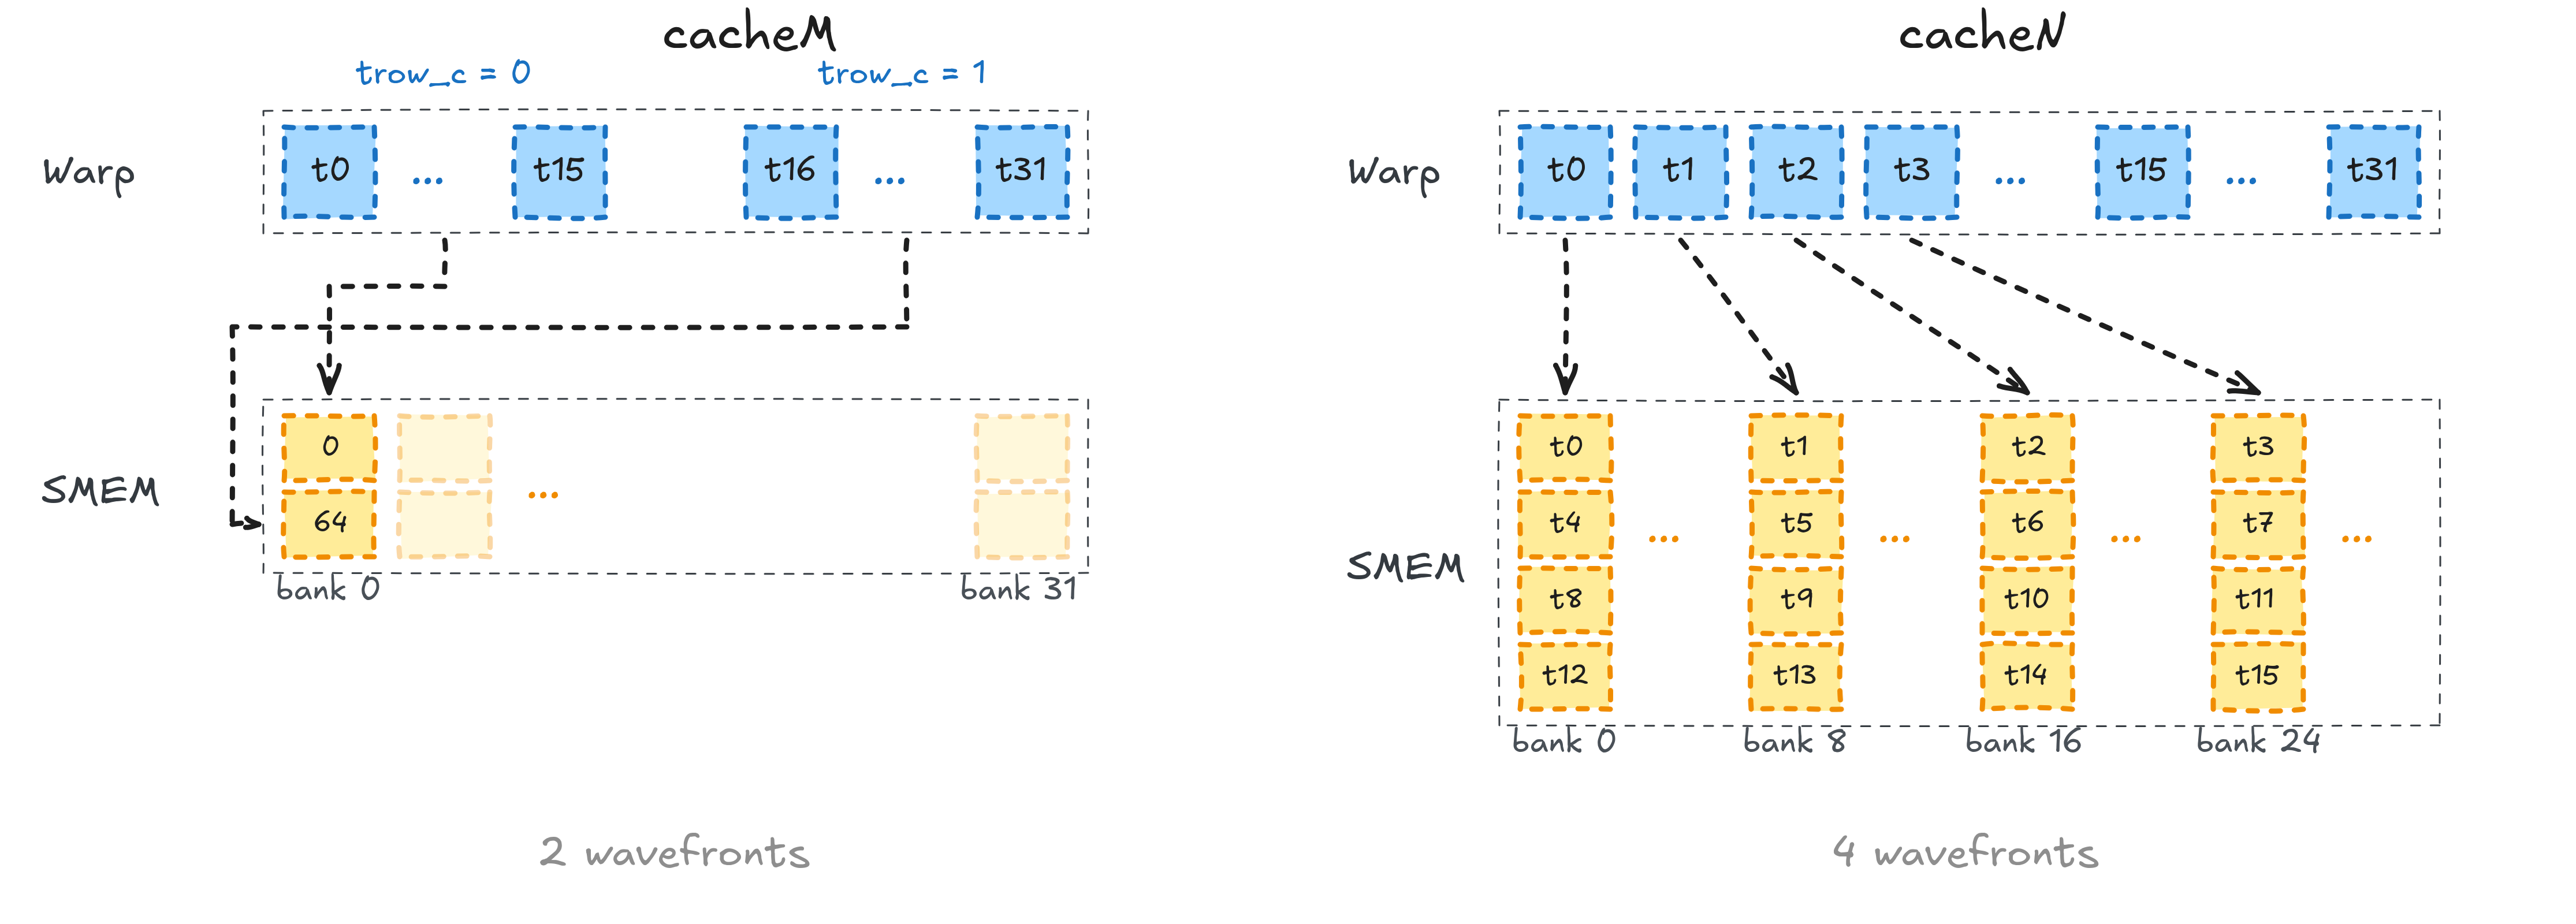 expandcacheM costs 2 passes; cacheN costs 4.
Kernel 6 & 7: Vectorization
We'll do two steps in one here: we'll try to decrease the amount of shared-memory bank conflicts06_2d_transposed.cu , and we'll try to decrease the amount of global memory requests by issuing a bigger load07_vectorize.cu .
Interestingly, changing layout of As in memory actually increased our wavefronts:
ncu --kernel-name BlockTiling2DTransposed --launch-count 1 --section SpeedOfLight --print-details all | grep "Data Pipe Lsu Wavefronts"

L1: Data Pipe Lsu Wavefronts                                       %        80.75
even though it is a 4.5% speedup!
ncu --kernel-name BlockTiling2DTransposed --launch-count 1 --section WarpStateStats

    Table Name : Warp State (All Cycles)
    ------------------------ ----------- ------------
    Metric Name              Metric Unit Metric Value
    ------------------------ ----------- ------------
    Stall Not Selected              inst         1.82
    Stall Long Scoreboard           inst         1.01
    Selected                        inst         1.00
    Stall Barrier                   inst         0.67
    Stall Short Scoreboard          inst         0.67
    Stall MIO Throttle              inst         0.66
    Stall Dispatch Stall            inst         0.42
    Stall Wait                      inst         0.23
    Stall LG Throttle               inst         0.12
    Stall Math Pipe Throttle        inst         0.11
    Stall No Instruction            inst         0.01
    Stall Branch Resolving          inst         0.00
    Stall Drain                     inst         0.00
    Stall IMC Miss                  inst         0.00
    Stall Membar                    inst            0
    Stall Misc                      inst         0.00
    Stall Sleeping                  inst            0
    Stall Tex Throttle              inst            0
    ------------------------ ----------- ------------
If we sum up 7.16 for BlockTiling2D vs 6.72 for the transposition, that's roughly a ~6% decrease, matching the time gain.
Not too sure what the dispatch stalls could genuinely be - the documentation is vague about it. Closest I could find: https://forums.developer.nvidia.com/t/what-cause-dispatch-stall-how-to-avoid-it/233021/10
While we're here, we should take a look at our GMEM loads. Since we pass pointers, the compiler can't immediately assume they are aligned. We explicitly cast them to float4 to get a 128-bit load.
ncu --kernel-name VectorizedGMEM --launch-count 1 --section WarpStateStats

Table Name : Warp State (All Cycles)
------------------------ ----------- ------------
Metric Name              Metric Unit Metric Value
------------------------ ----------- ------------
Stall Not Selected              inst         1.81
Selected                        inst         1.00
Stall Dispatch Stall            inst         0.66
Stall Short Scoreboard          inst         0.60
Stall MIO Throttle              inst         0.58
Stall Barrier                   inst         0.51
Stall Long Scoreboard           inst         0.49
Stall Wait                      inst         0.19
Stall Math Pipe Throttle        inst         0.04
Stall LG Throttle               inst         0.01
Stall No Instruction            inst         0.01
Stall Branch Resolving          inst         0.00
Stall Drain                     inst         0.00
Stall IMC Miss                  inst         0.00
Stall Membar                    inst            0
Stall Misc                      inst         0.00
Stall Sleeping                  inst            0
Stall Tex Throttle              inst            0
------------------------ ----------- ------------
We can see that LG Throttle and Long Scoreboard are down. LG throttle is the same idea as MIO throttle, but for the L1TEX instruction queue rather than the MIO queue.
Kernel 8: Warptiling
The real improvement comes from warptiling. With the knowledge of shared memory bank conflicts, let's tile in a way that is more warp-aware.
Hopefully this animation can convey the intent:
We assign a specific tile to a warp so the threads will work in a way that is contiguous in memory.08_warptiling.cu
We can also use the knowledge of shared-memory bank conflicts to explain why these tuned values were chosen:
const int m_block = 128;
const int n_block = 128;
const int k_block = 16;

const int m_thread = 8;
const int n_thread = 8;

const int m_warp = 64;
const int n_warp = 32;
We hand each warp a 64x32 tile because the warp's 32 threads then cover 32 consecutive floats of Bs, which gives 0 shared-memory bank conflicts. The 8x8 thread tile is the trade-off between register count and reuse that the sweep found.
Kernel 9 & 10: Staging
Here are the two attempts I made at tackling this: 09_prefetch.cu 10_prefetch_reg.cu
Currently our warps are stalling on a very "bursty workload". Here's what I mean:
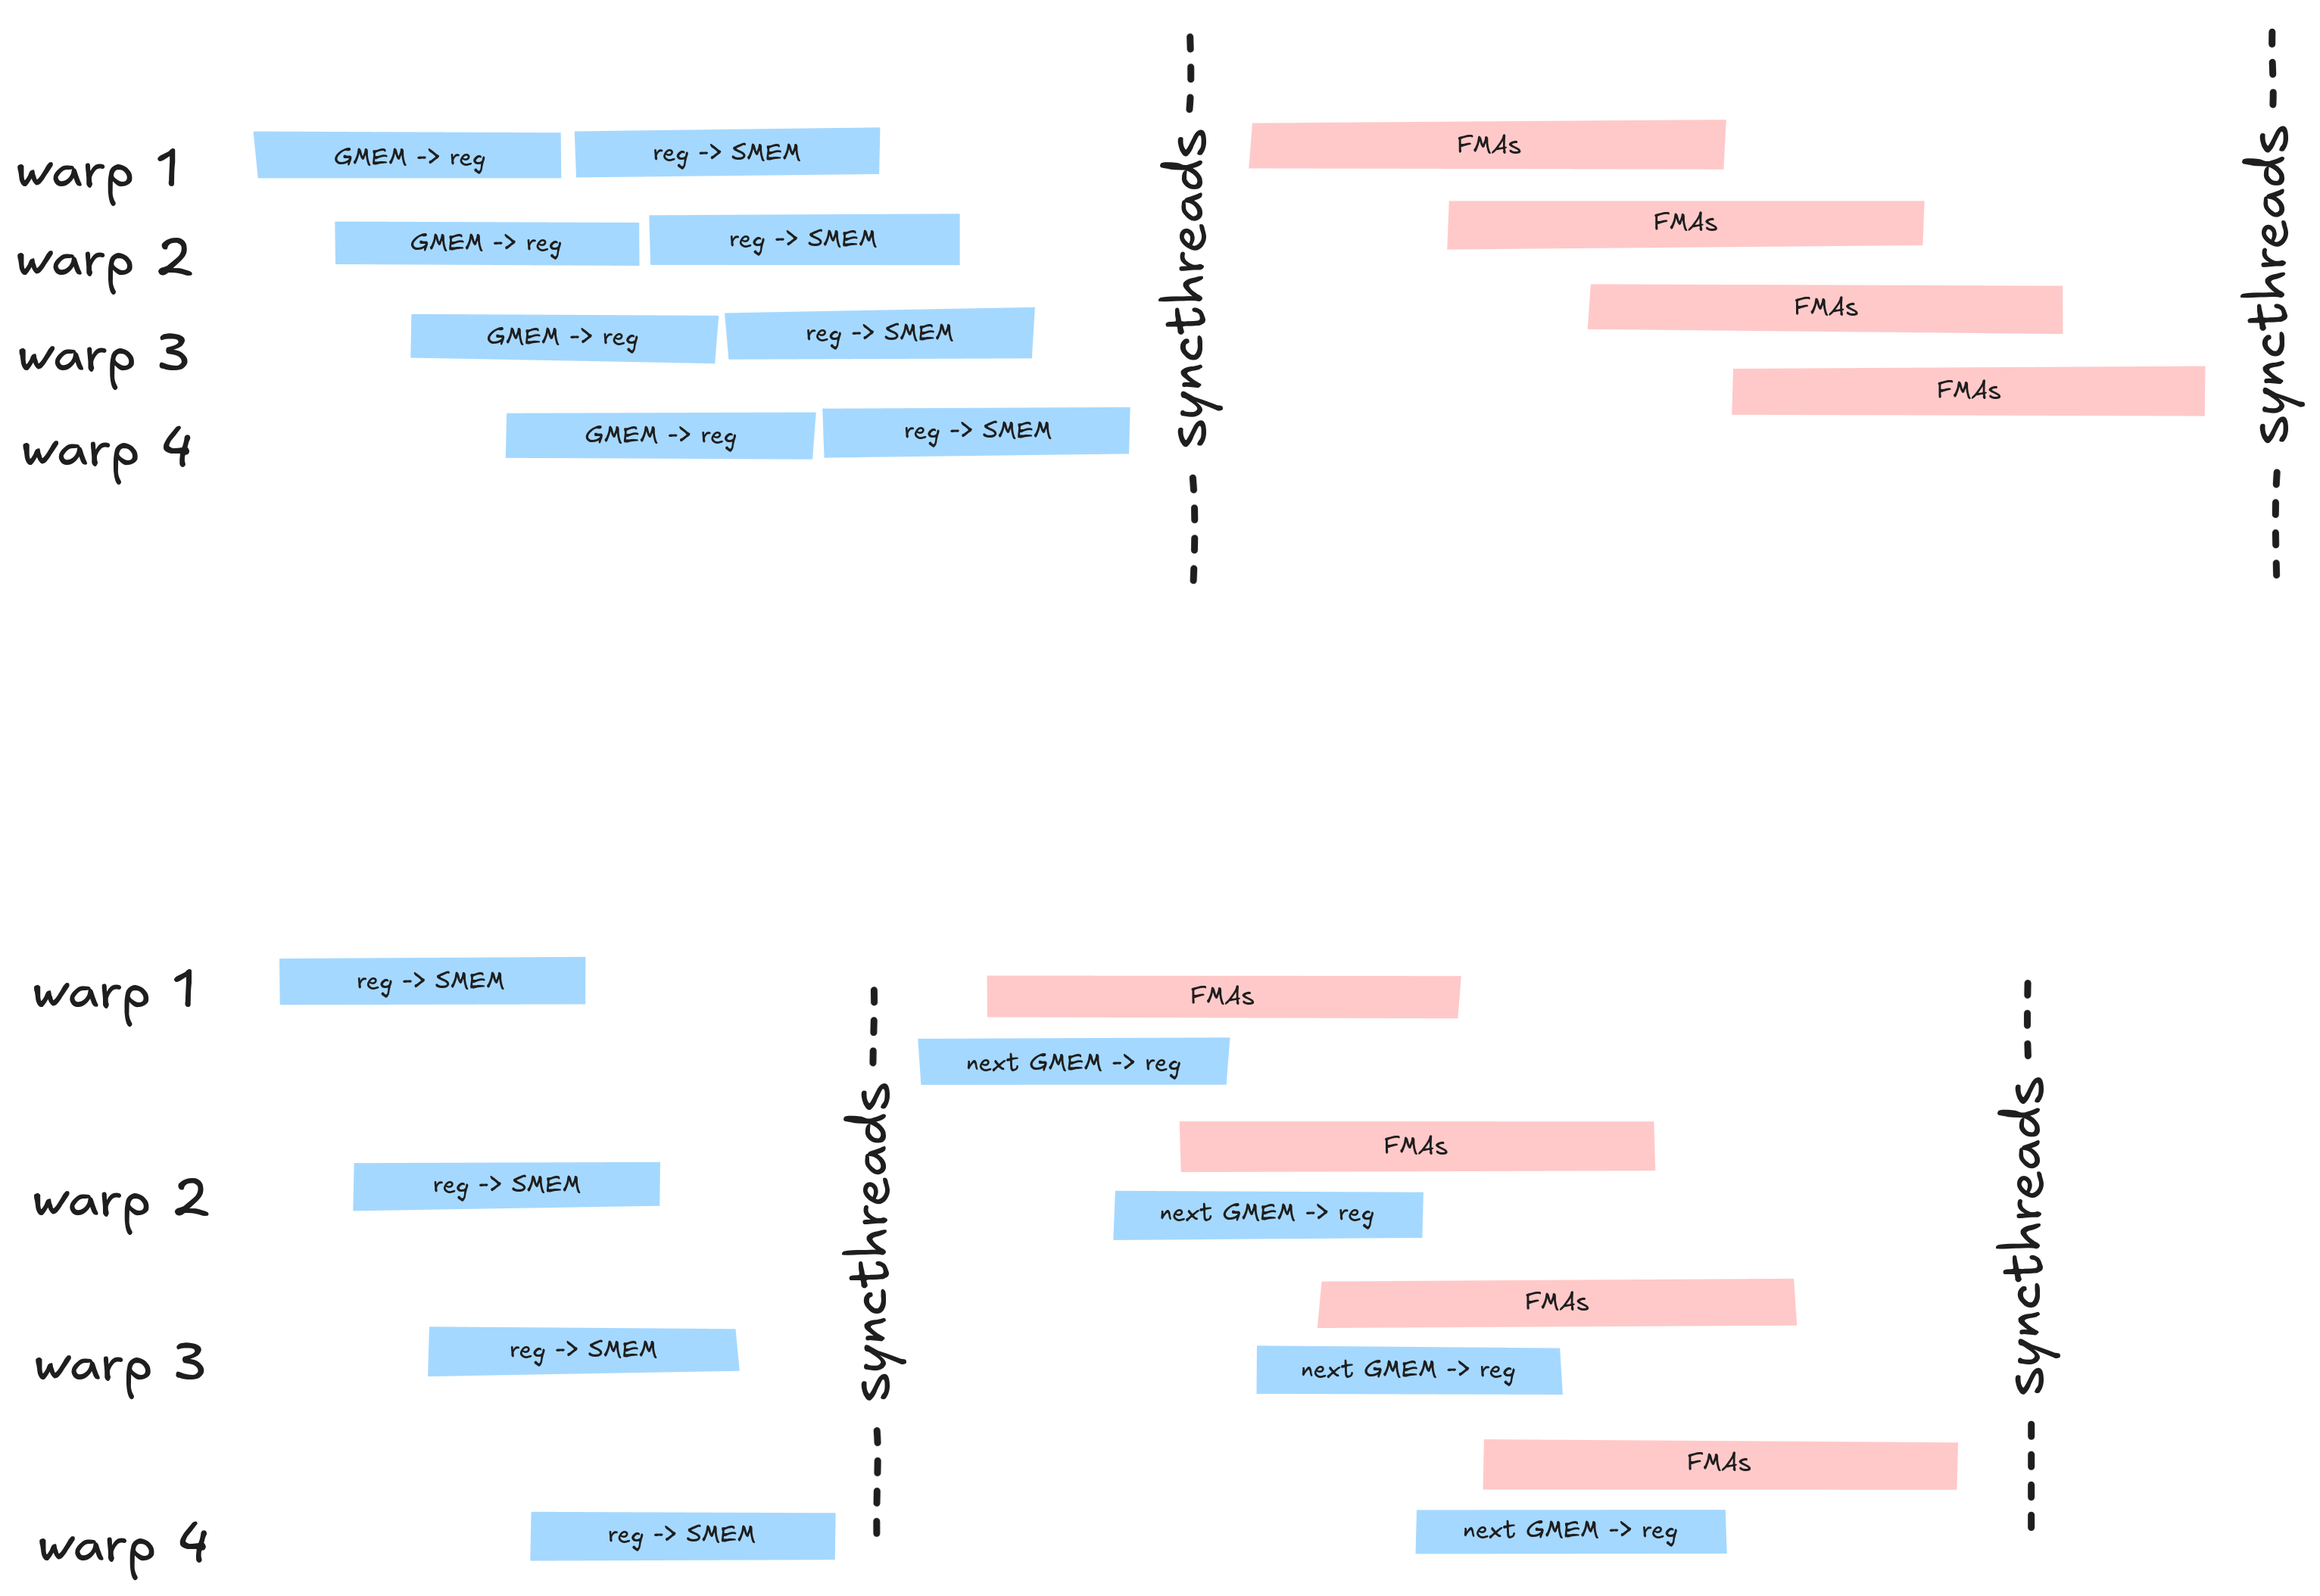 expandbursty: load, store, barrier; the FMAs don't overlap the load.
We can expose more ILP by loading the next iteration's tile as we do our FMAs. This brings us to a final 110% of cuBLAS, and we can see ncu stats:
ncu --kernel-name StagedTpl --launch-count 1 --section WarpStateStats --print-details all

Table Name : Warp State (All Cycles)
------------------------ ----------- ------------
Metric Name              Metric Unit Metric Value
------------------------ ----------- ------------
Selected                        inst         1.00
Stall Not Selected              inst         0.65
Stall Dispatch Stall            inst         0.32
Stall Barrier                   inst         0.21
Stall Long Scoreboard           inst         0.17
Stall Short Scoreboard          inst         0.08
Stall Wait                      inst         0.05
Stall MIO Throttle              inst         0.03
Stall Math Pipe Throttle        inst         0.01
Stall No Instruction            inst         0.01
Stall Branch Resolving          inst         0.00
Stall Drain                     inst         0.00
Stall IMC Miss                  inst         0.00
Stall Membar                    inst            0
Stall Misc                      inst         0.00
Stall Sleeping                  inst            0
Stall Tex Throttle              inst            0
------------------------ ----------- ------------
long scoreboard 0.55 → 0.17 and barrier 0.41 → 0.21 versus 08.
Misses
Of course, it's important to talk about the number of kernels we've gone through on our quest to punch through cuBLAS.
Various attempts at staging
I tried prefetching the entire SMEM tile. During the iteration, it would load the next k-tile. It also removes a barrier: with two buffers you only need the read-after-write sync, not the write-after-read one. However, because the store to SMEM was struck waiting on the load from GMEM, it only increased Long Scoreboard (GMEM) stalls. That's why splitting it up into two stages was the fix.
Another version I tried was prefetching the next registers from SMEM. This worked: 102%. It couldn't go further because it hides shared-memory latency, while the bigger stall was global memory.
cp.async
Our current approach splits the GMEM -> reg -> SMEM into 2 stages. On Ampere, there's an actual instruction (LDGSTS) that can do that operation without going to registers first!
I tried 2 approaches with this as well:
1: cp.async 4B, transposed: This one throttled the MIO queue. It also didn't help that the cp.async is very "bursty", happening before the dot loop, which clogs up the queue instead of interleaving in between FFMAs.
2: cp.async 16B, non-transposed: MIO throttle doesn't improve (0.19 vs 0.20); what improves is the instruction count. But dropping the transpose makes it L1TEX-bound at 80.7%, so it's still slower.
Conclusion & Next Steps
Coming from CPU GEMM, working on GPUs was quite different. CPUs give you built-in latency-hiding (OOO, speculation), but you have to think deeply about how to parallelize and control your caches. GPUs give you built-in parallelism and more explicit cache control, but pushing that last 10% was all about how to pipeline on the GPU effectively.
Re: pipelining, a lot of it was also playing nice and making explicit to the compiler (forced unrolling) to deliberately schedule and interleave instructions. After hitting 90%, the remaining gains were all about profiling stalls, and hiding stalls behind FMAs.
Reasoning on a GPU is not easy, especially with the immense parallelism and the tiers (grids/blocks/warps/threads). Indexing math can get especially tricky, especially since it's usually beneficial to use 1 dimension and manually index for more control.
We ended up at 9.66 TFLOP/s - which is 110% of cuBLAS at 4096^3.
Probably going to try this on Tensor Cores with fp16 datatypes. Tensor Cores are going to be very different, but it'll unlock a huge FLOP gain.
All code can be found here: https://github.com/GuyOnWifi/gpu-matmul-rung
Resources
- https://modal.com/gpu-glossary - very great for getting started into GPU land.
- https://siboehm.com/articles/22/CUDA-MMM - the OG.
- https://docs.nvidia.com/nsight-compute/ProfilingGuide/index.html - extremely detailed for getting into profiling.